Monday, 19 April 2021
Written by Amirudin Hamid, Portfolio Manager of GAX MD

In the recent weeks, the market has been a bit more challenging for investors. The financial market has turned more fragile and volatile than usual. More and more investors are getting worried that rising bond yields might weigh on their portfolios' performances.
The yield on the US 10-year Treasury has been rising since hitting rock bottom in August 2020, but only gained investors' attention in late February 2021 when it rose above 1.50% for the first time since February 2020.
Often times, climbing treasury yields carry negative perceptions by virtue of the inverse relationship between bond prices and yields. Whenever yields go up, the bond prices go down. Besides, higher yields make investing in stocks and other assets less attractive. That is why investors always assume that rising treasury yields are bad for investments.
Is that really the case? Does the current rising treasury yield negatively impact MYTHEO’s portfolio? This article looks deeper into the past, the period in which the US 10-year Treasury yield rose more than 1.0%. We used the US 10-year Treasury because it is the most followed yield across all the yield curves.
Secondly, this article also discusses the impact of the rising US 10-year Treasury yield on MYTHEO’s portfolio by looking at the correlation of ETFs inside MYTHEO against the US 10-year Treasury yield.
How MYTHEO’s Functional Portfolios’ Performed during High Yield Cycles in the Past?
There were two occasions in the last ten years when the US 10-year Treasury yield rose by more than 1%:
1. From July 2012 to December 2013; and
2. from July 2016 to November 2018.
Chart 1: Chart of the US 10-year Treasury Yield Cycle from 2011 to 2021
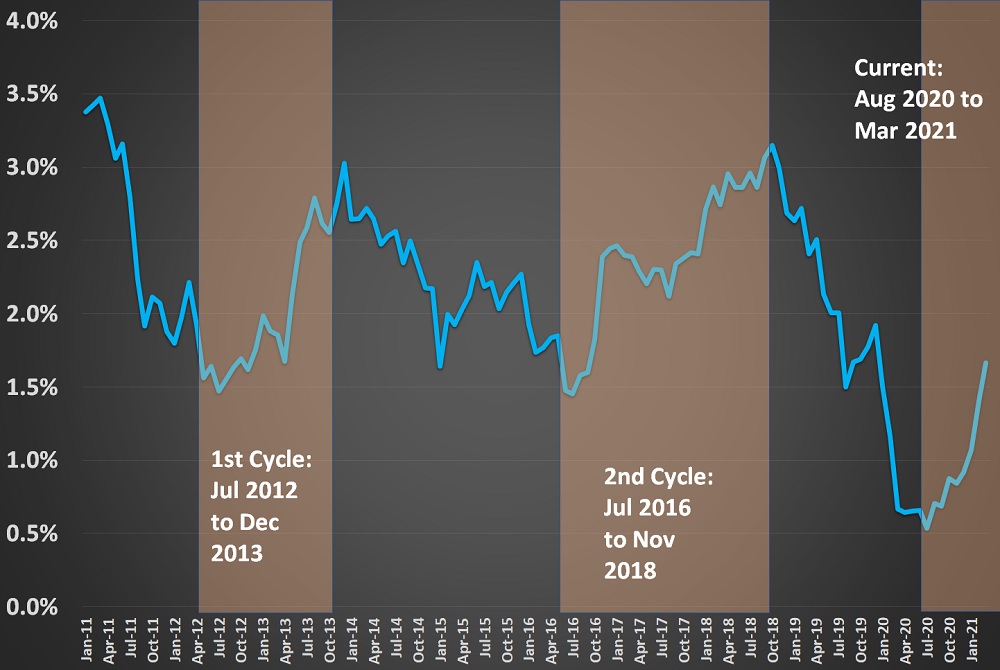
Note: Past performance is not an indication of future performance
In the first cycle (July 2012 to December 2013), the US 10-year Treasury yield rose by 1.63%. It started to inch higher from 1.39% in July 2012 and peaked at 3.03% in December 2013, which translates to an upcycle of 18 months.
In this first cycle, the Growth portfolio went up firmly by 41.56% in MYR. The Income portfolio’s return was more modest, which was a gain of 4.20% in MYR. The Inflation Hedge portfolio recorded a marginal loss of 0.76% in MYR due to commodity prices softening in 2013.
Chart 2: MYTHEO’s Functional Portfolios’ Back-tested Performances in MYR from July 2012 to December 2013
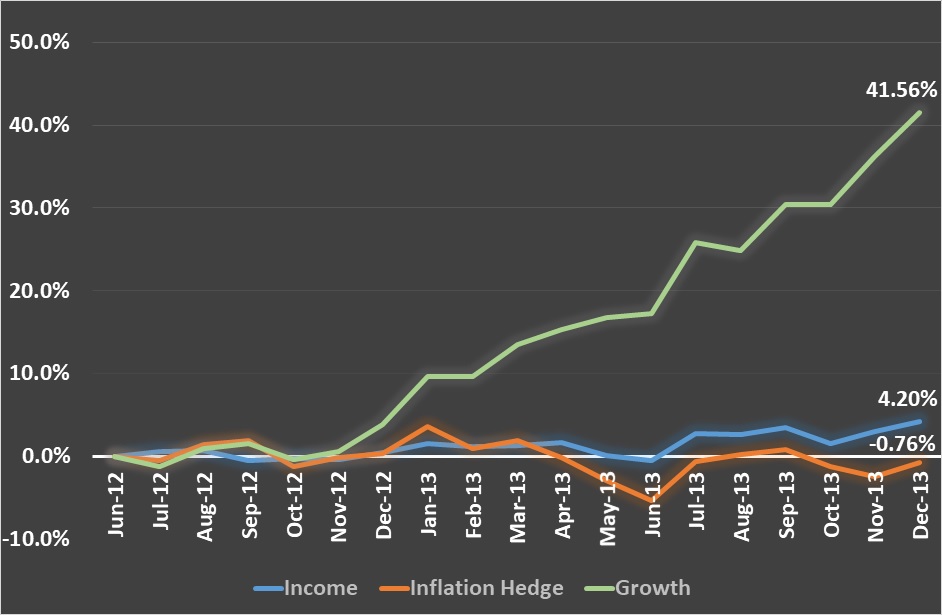
Note: Past performance is not an indication of future performance
The second cycle from July 2016 to November 2018 was a bit different than the first cycle. The yield had a longer upcycle, and the quantum of the rise was also larger. The US 10-year Treasury yield rose from 1.36% in July 2016 to a peak of 3.24% in November 2018, i.e., a rise of 1.88% over a period of 29 months.
On top of that, the US Federal Reserve was also very active and had raised the interest rate nine times from December 2015 to December 2018 to tame inflation. Consequently, investors were faced with more challenges in navigating the market as the rates for both long-term Treasury securities and short-term securities were rising.
Chart 3: MYTHEO’s Functional Portfolio’s Back-tested Performances in MYR from July 2016 to November 2018
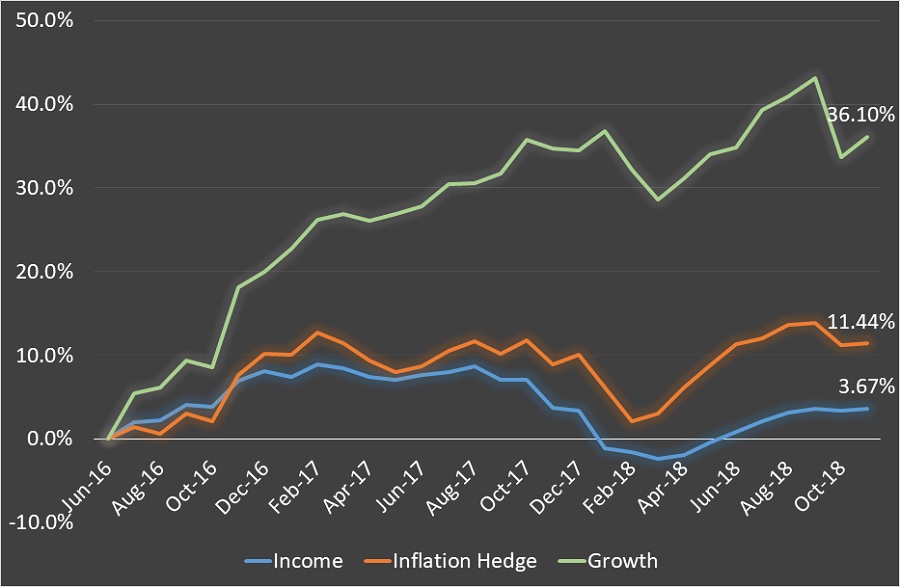
Note: Past performance is not an indication of future performance
As shown in Chart 3 above, despite multiple headwinds arising from higher short-term and long-term interest rates, all functional portfolios rode through the cycle with positive returns. The Growth portfolio gained substantially by 36.10% in MYR, the Income portfolio increased by 3.67% in MYR and the Inflation Hedge portfolio rose by 11.44% in MYR. The Inflation Hedge portfolio performed much better in the second cycle because commodity and real estate were in the upcycle.
Investors endured more volatility in the financial market, particularly in 2018. At one point, all portfolios dipped significantly when the inflation scare grabbed the headlines and that the Federal Reserve might raise the interest rate much quicker than initially expected. Nonetheless, the market drop lasted for just three months, in which it started in January 2018 and ended in March 2018 when it rebounded.
Correlation Between ETFs and US 10-year Treasury Yields
The financial market is highly efficient. There are many factors that can influence the movement of these assets. To specifically assess the impact of a rising yield on MYTHEO’s portfolio, we looked into the correlation between the US Treasury yields against each individual ETF’s performance.
What is Correlation and How it Works?
Basically, correlation is a statistical study that measures the relationship between two variables. In general, the correlation ranges between -1 to +1. Under the rule of thumb, a correlation of "-1" means a perfect negative relationship between two assets. So, when one asset goes up, the other should fall by a similar amount. For example, if the correlation between ETF A and ETF B is "-1", a positive return of 10% for ETF A means a negative 10% return for ETF B.
On the other hand, if the correlation between ETF A and ETF B is "+1", a positive return of 10% for ETF A resulted in a positive return of 10% for ETF B.
And if the correlation between the two ETFs is zero, it indicates there is no relationship between them. That means both ETFs move randomly or independently from each other.
Therefore, if the correlation moves closer to zero, this indicates a weaker relationship between the two ETFs. Similarly, when the number is closer to +1, the positive relationship between the two ETFs is stronger and vice versa.
What Does the Correlation of ETFs Inside MYTHEO and US 10-Year Treasury Yield Look Like?
We use correlation to measure each individual ETF's sensitivity against the yield on a 10-year treasury in this study. Also, we used the US 10-year Treasury yield because it is the most widely followed treasury securities by professional investors. We used historical data for the past ten years (from February 2011 to February 2021).
Chart 4 (a): Correlation Between the ETFs Inside the Growth Portfolio andthe US 10-year Treasury Yield
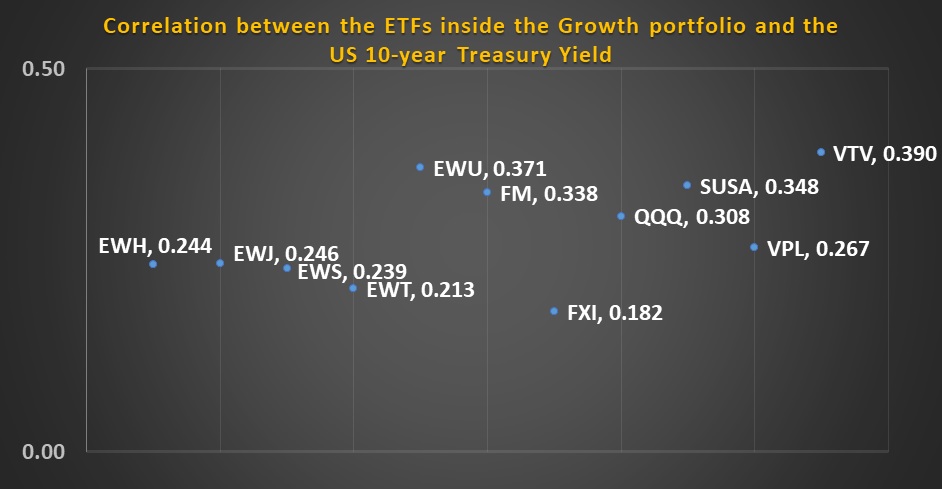
Note: Past performance is not an indication of future performance
Chart 4 (b): Correlation Between the ETFs Inside the Income Portfolio and the US 10-year Treasury Yield
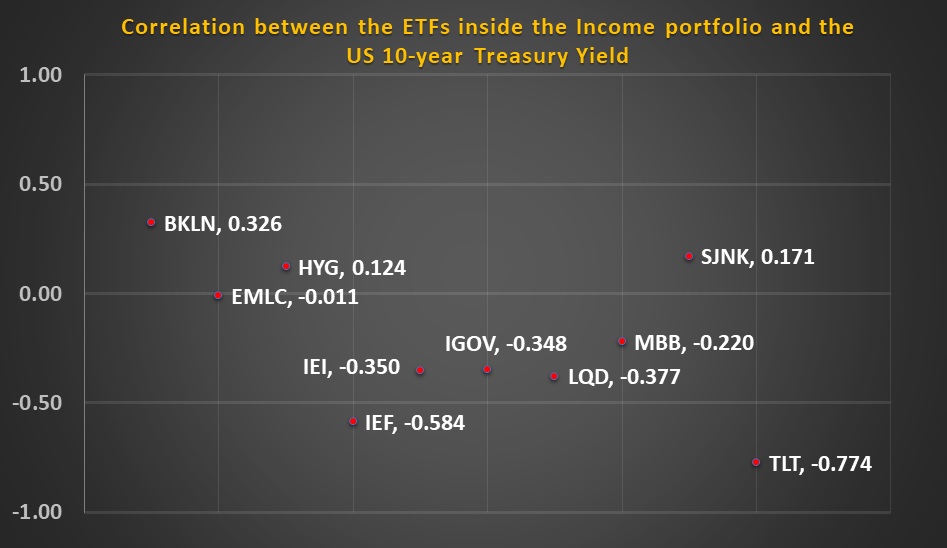
Note: Past performance is not an indication of future performance
Chart 4 (c): Correlation Between the ETFs Inside the Inflation Hedge Portfolio and the US 10-year Treasury Yield
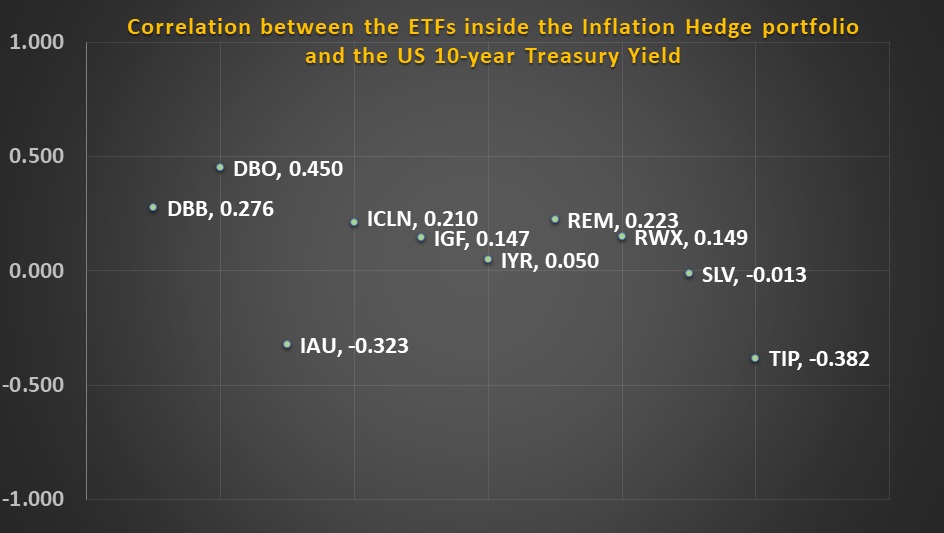
Note: Past performance is not an indication of future performance
Chart 4 (a) shows that all ETFs inside the Growth portfolio are positively correlated to the US 10-year Treasury yield, which means that rising treasury yield is favourable to MYTHEO's Growth portfolio. But the sensitivity or relationship between each ETF and the US Treasury is relatively mild, with correlations between 0.182 to 0.390.
Chart 4 (b) shows that any change in the US 10-year yield gets a mixed reaction from the Income ETFs. It is of little surprise that all treasury ETFs, such as IEI (iShares 3-7 Year Treasury Bond ETF), IEF (iShares 7-10 Year Treasury Bond ETF), IGOV (iShares International Treasury ETF) and TLT (iShares 20+ Year Treasury Bond ETF) are negatively correlated to the US 10-year Treasury yield. Therefore, you can expect that all treasury securities are likely to fall when yields rise. TLT has the longest time to maturity and therefore, is the most sensitive to the changes in treasury yield.
Some income ETFs are on the winning side when yields are rising. The high-yield bond ETFs are influenced more by credit risks rather than the US Treasury yield. These bonds are issued by corporates that have weaker financials, high leverages and do not have a strong cash flow. More often than not, rising treasury yields reflect better economic outlook and business activities. Hence, many corporates are in better shape to service their borrowings and are assigned lower credit risks.
In the Inflation Hedge portfolio, commodities and real estate demonstrate a positive correlation with the US 10-year treasury yields. As mentioned earlier, rising treasury yields tend to follow improving economies where demand for commodity and real estate are on the rise.
On the opposite side, the gold is less appealing if treasury yields are higher. Meanwhile, inflation hedge bond, iShares TIPS Bond ETF (TIP) usually trades lower if yields rise faster than inflation.
Conclusion
Both historical performance and correlation showed that rising US Treasury yields have never been a threat. The fear that an increasing yield could undermine a long-term return to investors is overblown. The historical back-tested performance showed that all MYTHEO's functional portfolios were generally up, except for the Inflation Hedge portfolio that dropped marginally in the first cycle from July 2012 to December 2013.
The truth is that treasury yields are rising on the backdrop of a brighter economic growth prospect and when business activities are accelerating. This explains why the Growth portfolio did so well in both cycles. High-yield bonds, commodities and real estate performed well in higher yield environments for the exact same reason.
Treasury ETFs are the most apparent losers due to a direct inverse relationship with yields. But high-yield bonds ETF’s performance could help offset these losses. Because of this, investors did not lose money by staying invested in the Income portfolio during rising yield cycles in the past ten years. Gold and inflation hedge bonds are vulnerable but not as sensitive to yield movements as compared to treasuries that have longer term maturities like TLT.
All things considered; it is likely that more winners than losers inside the MYTHEO portfolio will prevail against rising yields. Only 10 out of 31 ETFs across all functional portfolios are correlated negatively to the US 10-year treasury yield. Furthermore, 29 out of 31 ETFs that are currently activated in MYTHEO have a correlation between -0.40 to +0.40. This is a clear proof that most ETFs in our holding have low sensitivities to the change in treasury yields.
More importantly, investors have to be mindful that the financial market is complex and at the same time, very efficient. Hence, financial assets tend to price and react to almost every possible economic, financial and political news, currency movements and even human emotions. At every financial asset’s movement, there will always be multiple factors driving its pricing volatility. The treasury yield is just one of these many factors. Never overreact when one factor becomes favourable or otherwise.
Besides, MYTHEO’s portfolios are designed to have strategic diversification across different assets and countries. Therefore, your investment with MYTHEO is not overly exposed to a single factor or event. This is how we help you achieve your long-term financial objective smoothly with a peace of mind.
This material is subjected to MYTHEO's Notice and Disclaimer.