Thursday, 23 January 2020
Written by Amirudin Hamid, Portfolio Manager of GAX MD

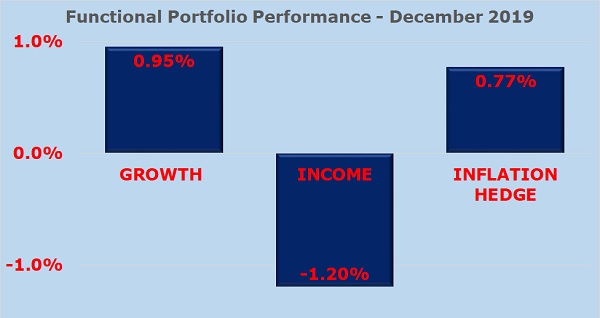
The currency movement had a significant impact on the functional portfolios’ performance in December 2019. Weaker USD led to a better performance of the Non-US assets and commodity-related asset classes. The Growth portfolio was up by 0.95%, driven by the rally in the stock market. The Inflation Hedge portfolio advanced by 0.77%, supported by the rally in commodities prices, but the Income portfolio was down by 1.20% due to the continued rise in bond yield.
Source: GAX MD Sdn Bhd
Note: Past performance is not an indication of future performance
The GROWTH portfolio rose by 0.95% in MYR
In December, the equities market extended the rally for the fourth month in a row. It is no secret that the US stock market has been more vibrant throughout the year. But in December, the US stock market was outpaced by stock markets in Europe and Asia. In particular, iShares MSCI UK ETF (EWU) gained the most with a return of 3.18% after investors reacted positively to a massive win by the conservative party. The British Pound (GBP) had strengthened by 2.53% against US Dollar (USD).
iShares MSCI Frontier 100 ETF (FM) continues to show positive returns. In November, the ETF was up by 3.39% and gained an additional 2.20% to round-up a solid performance over the past two months. FM invests mainly in smaller emerging markets such as Kuwait, Vietnam, Morocco, Kenya, Romania, Nigeria and Sri Lanka.
Despite a 1.02% dip in November, iShares Hong Kong ETF (EWH) was up by 2.08% in December which offset losses in November.
The INCOME portfolio dropped by 1.20% in MYR
The bond yields continue to move upwards since hitting the trough in August. As a result, we had another month of correction in the bond asset classes.
The bonds with longer expiry dates saw bigger drops. In MYTHEO, the iShares 20+ Year Treasury Bond ETF (TLT) dropped by 5.21% in December and was the worst-performing ETF inside the Income portfolio. It was because the longer duration bonds are more sensitive to the ups and downs in the bond yield. It tends to drop faster when the yield is up and rise faster when the yield is down.
However, weaker USD led to better performances of Non-USD bonds. The Van Eck Vectors J.P. Morgan EM Local Currency Bond ETF (EMLC) grew by 2.05% in MYR and was the top-performing ETF in the Income portfolio. EMLC invests in emerging countries bonds and trade in local currency. For example, Brazillian bonds or Indonesian bonds held by the ETF are quoted in Brazillian Real (BRL) or Indonesian Rupiah (IDR) respectively.
Investors have to be mindful that bonds generally carry lower risks that could help balance out the extra risks taken by investing in more volatile instruments such as equities and commodities. In addition, bondholders will receive regular payment of income and get paid a principal in full at the maturity. Due to this, there is a downside support to bond prices unless the bond issuer defaults.
The current negative momentum in the bond prices is mainly due to active investors selling the bonds to invest in riskier asset classes such as equity and commodity. Changes in market momentum are never easy to predict. One shouldn’t avoid investing in bonds just to chase the momentum of the market. It is important to view the bigger picture by having an optimized portfolio all the time, which means having a strategic combination of different asset classes all the time.
The INFLATION HEDGE portfolio rose by 0.77% in MYR
Inflation Hedge portfolio consists of ETFs that invests in physical asset classes such as commodity, real estate and infrastructure. In particular, commodity is a high-risk asset class that tends to perform better when the USD weakens.
Coincidently, crude oil had a big rally in December, mainly due to the surprise drawdown of the US inventory and the agreement made by the Organization of Petroleum Exporting Countries (OPEC) and several non-OPEC oil-producing countries. As a result, the Invesco DB Oil ETF (DBO) jumped by 7.80% to reflect a more positive outlook in the oil market. Other commodity ETFs also performed well. The Invesco DB Agriculture Fund (DBA) and iShares Gold Trust (IAU) rose by 1.97%, and 1.56% respectively.
Consistent with the trend that we saw in the Growth and Income portfolio, any ETF with significant exposure outside of the US market benefitted from the weakened USD.
In the Inflation Hedge portfolio, iShares Global Infrastructure ETF (IGF) was up by 1.86%. IGF invests in public listed companies globally, of which more than 70% of its underlying exposure is in infrastructure companies operated outside of the United States.
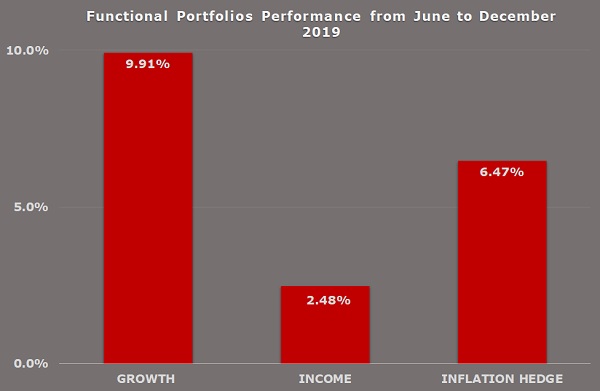
Summary of Performance Since Inception - June to December 2019
Source: GAX MD Sdn Bhd
Note: Past performance is not an indication of future performance
The above graph shows the performance of MYTHEO's functional portfolios since its inception in June 2019 to December 2019. The Growth portfolio registered a return of 9.91%, the Income portfolio was up by 2.48% and the Inflation Hedge portfolio gained 6.47%. The returns for the stipulated period was positive across all functional portfolios despite the ups and down in month-to-month performance.
It must be noted that, the actual portfolio returns to the investors is the combined weighted return from the allocation to each functional portfolio. For example, if an investor allocates the investment equally: 33.3% in Growth, 33.3% in Income and 33.3% in Inflation Hedge, the actual portfolio return is (33.3% x 9.91%) + (33.3% x 2.48%) + (33.3% x 6.47%) = 6.29% over a 7-month period from early June to December 2019.
What’s Happening in The World Market?
In the UK, the stock market and British Pound (GBP) had a perfect month in December. This was triggered by the landslide victory of Boris Johnson and his Conservative party in UK’s general election on 3 December 2019. From an investor’s perspective, the win reduces the uncertainty over Brexit.
The trade war between US and China has had its ups and downs throughout 2019. What better way to end the year than getting the US and China to reach an agreement in phase 1 of the trade deal that happened on 13 December 2019. The immediate positive outcome from the agreement is that the scheduled 15% tariff hike on US$150 billion imports from China was suspended.
The USD has been the best currency to hold for the past few years due to its steady appreciation in value against virtually all other currencies. The currency peaked in October and has been gradually trending downward ever since. The decline in USD accelerated in December and it was down by 2.06% against Malaysian Ringgit (MYR), which has been the weakest monthly performance since a 3.61% drop back in January 2018.
Our Thoughts
Currency played a big impact on the performance of MYTHEO’s functional portfolios in December. When the USD started to weaken, we had received many inquiries from concerned investors as MYTHEO invests in ETFs listed in US market and traded in USD.
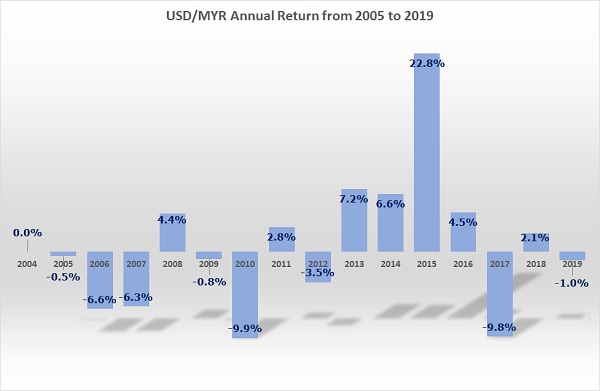
In the short run, currency risk can have a material impact on MYR returns for a global portfolio like MYTHEO. According to Chart 3 below, since MYR was unpegged in July 2005, the USD appreciated by 22.8% in 2015 and depreciated by 9.9% in 2010.
Chart 3: USD/MYR Annual Returns from 2005 to 2019
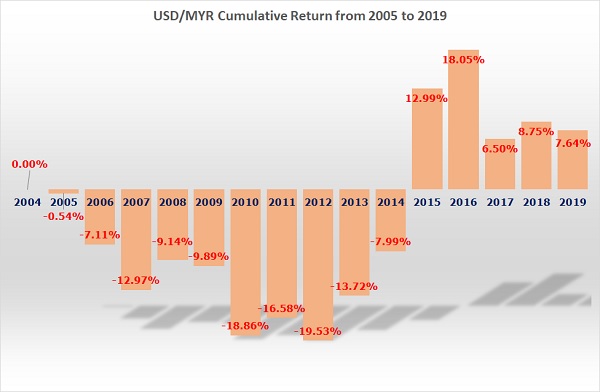
However, in the long-run, currency movement becomes less meaningful. Chart 4 below, shows that the accumulated performance of USD against MYR from 2005 to 2019. Over the period of 14 years, USD only appreciated against MYR by 7.6%. That works out to be only 0.52% compounded annually. Therefore, looking solely at the long-term impact of currency on your investment, it is very minimal.
Chart 4: Cumulative Returns from 2005 to 2019
Additionally, even though all ETFs in MYTHEO’s functional portfolios are listed in the US market and quoted in USD, it is not true that our portfolios are heavily exposed to USD and correlate with the performance of US market.
As you can see very clearly from the performances of MYTHEO’s functional portfolios in December, the underlying assets inside all 29 ETFs consists of equity, bonds, real estate and commodity asset classes from more than 80 countries and mostly quoted in local currencies. Therefore, our investments are not only concentrated to the US market or USD assets but are also significantly exposed to non-USD assets. Some of these assets may also gain when USD weakens.
Hence, through MYTHEO’s service, investors will get a globally diversified portfolio that is proven to work in any market cycle. Moreover, in order to mitigate the current currency volatility, we suggest investors continue to hold their portfolio with a long-term view to allow the currency gains or losses to smoothen out over the longer run.
NOTE:
We track MYTHEO's performance since inception in June 2019.
Comments on the performance and operational status of each functional portfolio above are from our model portfolio throughout the month. MYTHEO customer’s personalized portfolio is derived from the combined weight of each portfolio. Therefore, the actual portfolio performance to the client is dependent on the weightage of each portfolio. The actual personalized return to each client can be calculated using this formula:
Return of Personalised portfolio = (Weightage in Growth portfolio x Return of Growth portfolio) + (Weightage in Income portfolio x Return of Income portfolio) + (Weightage in Growth portfolio x Return of Inflation Hedge portfolio).