
Key Takeaways
- March marked a regime change where asset prices were driven less by economic data and more by geopolitical risk. The escalation around Iran and the vulnerability of the Strait of Hormuz triggered a rapid repricing across oil, currencies and equities, reshaping the investment landscape in a matter of weeks.
- The sell-off was not uniform. Energy-linked assets and the US Dollar strengthened, while Asia-led equities bore the brunt of the adjustment. This environment rewarded specific exposures rather than broad market positioning, highlighting the growing importance of structural and regional differentiation.
- In a market driven by fear and rapid repricing, outcomes were determined by underlying portfolio design. Exposure to energy, agriculture and currency movements provided critical offsets, while concentrated equity positions faced pressure. This reinforces the value of a systematic, multi-asset approach in navigating unpredictable shocks.
MYTHEO omakase PORTFOLIOS
Omakase combines Growth, Income & Inflation Hedge in an optimised weightage proportion that is personalised accordingly to your risk profile. Your return is the weighted sum of these three functional portfolios.
1. Growth Portfolio
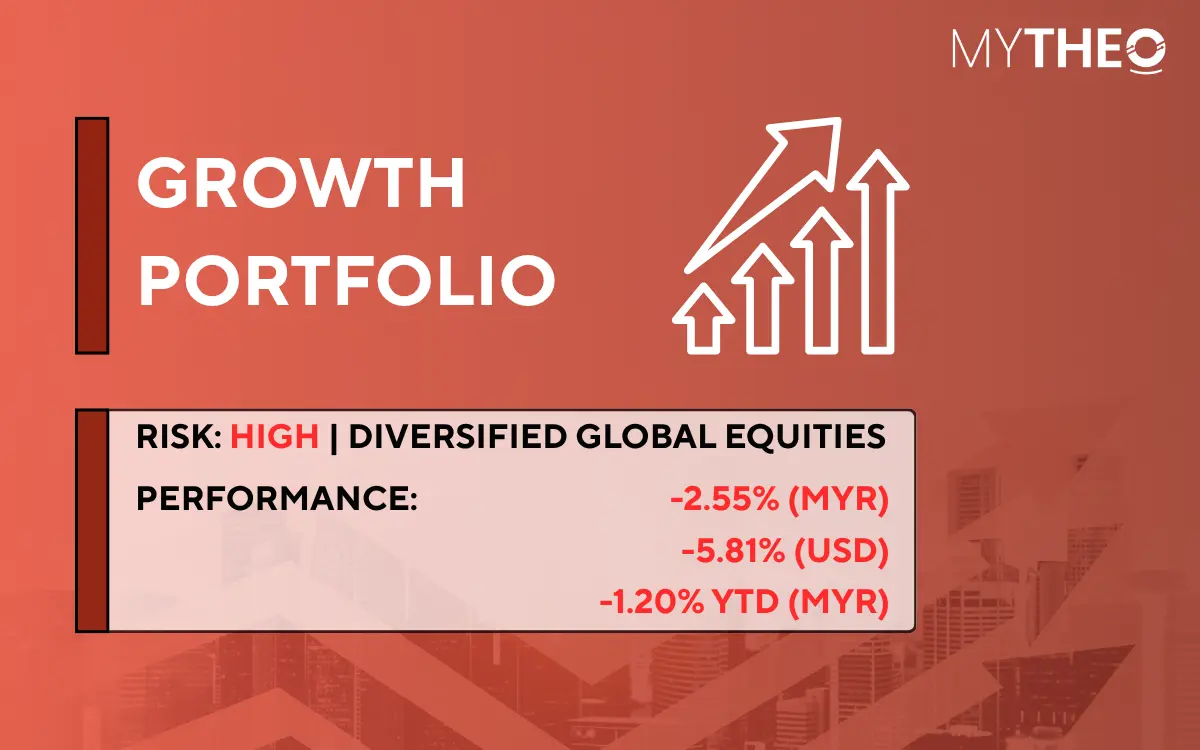
*YTD = Year to Date
*Source: GAX MD Sdn Bhd, data in USD term for the month of March 2026
Past performance is not an indication of future performance.
2. Income Portfolio
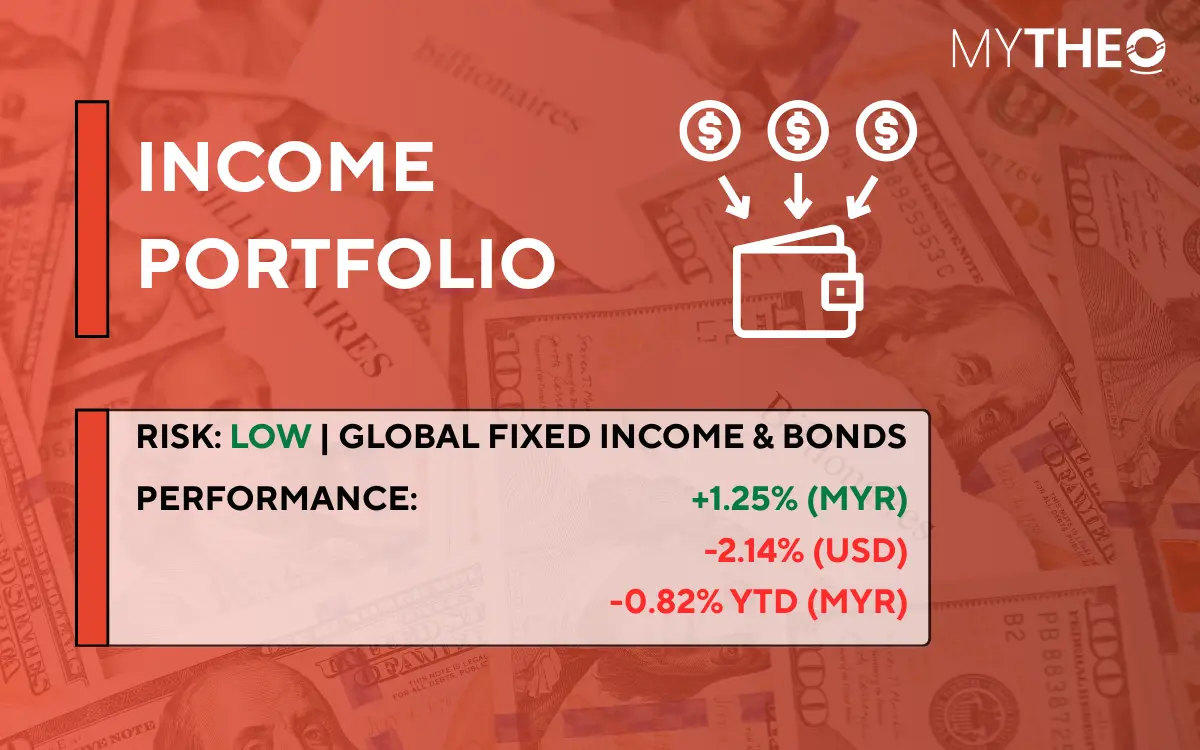
*YTD = Year to Date
*Source: GAX MD Sdn Bhd, data in USD term for the month of March 2026
Past performance is not an indication of future performance.
3. Inflation hedge Portfolio
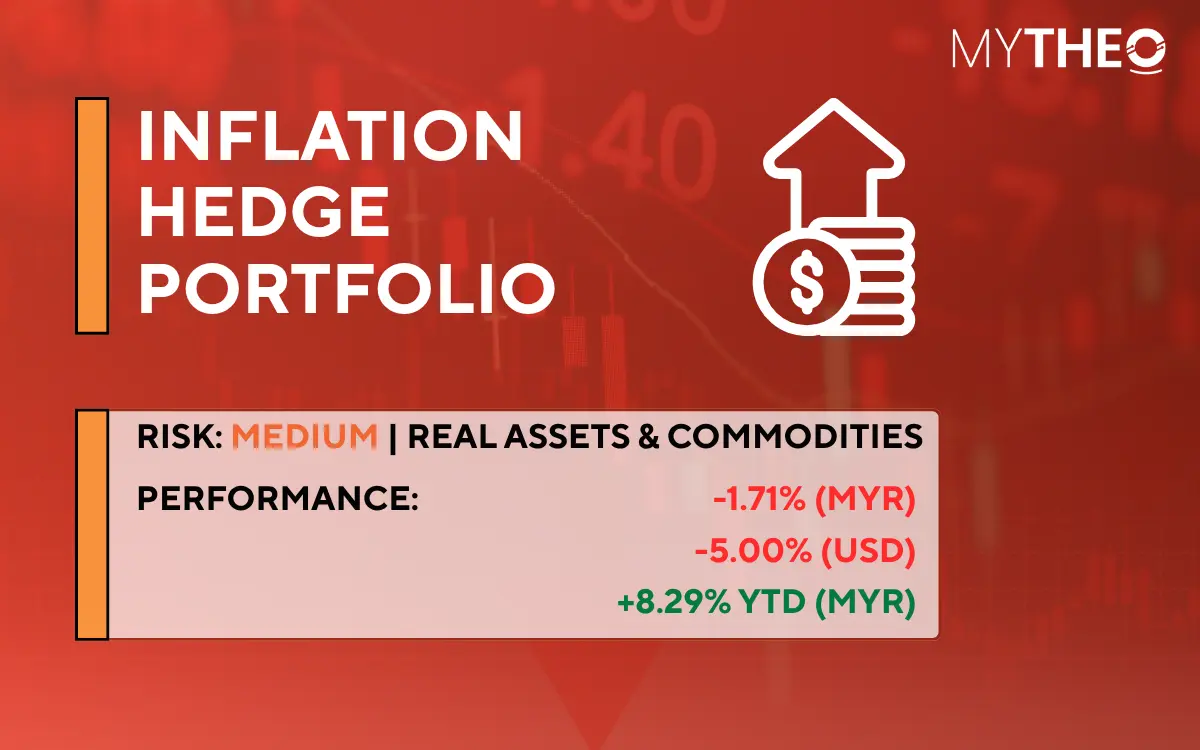
*YTD = Year to Date
*Source: GAX MD Sdn Bhd, data in USD term for the month of March 2026
Past performance is not an indication of future performance.
MYTHEO satellite PORTFOLIOS
Global ESG, Essential Products, and Izdihar are standalone portfolios — each with its own investment theme. They can be held independently or alongside an Omakase allocation.
4. Global ESG Portfolio
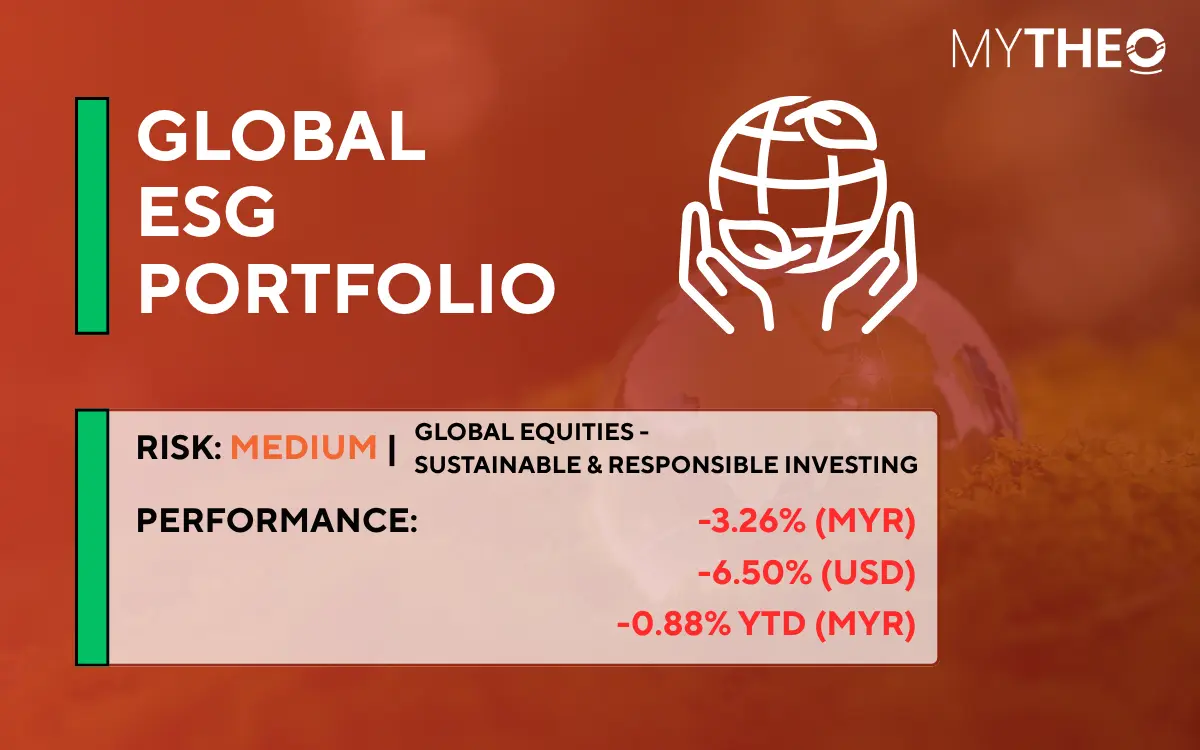
*YTD = Year to Date
*Source: GAX MD Sdn Bhd, data in USD term for the month of March 2026
Past performance is not an indication of future performance.
5. Essential Products Portfolio
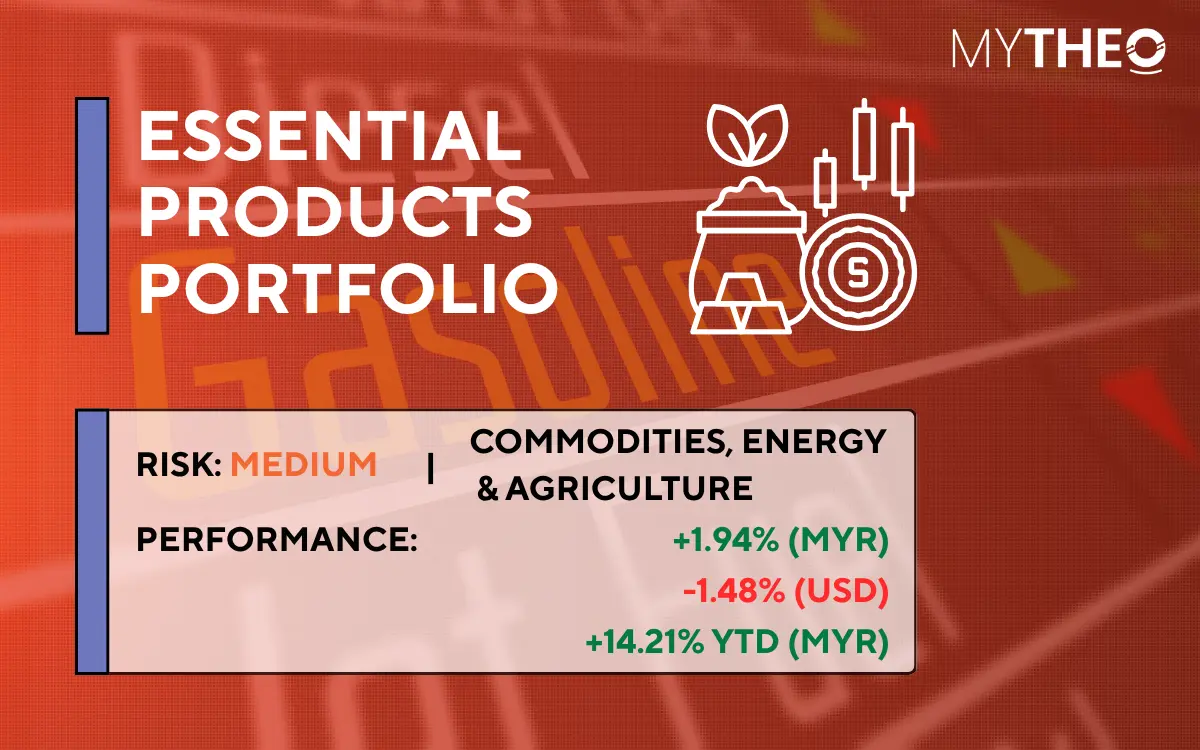
*YTD = Year to Date
*Source: GAX MD Sdn Bhd, data in USD term for the month of March 2026
Past performance is not an indication of future performance.
6. Izdihar Portfolio
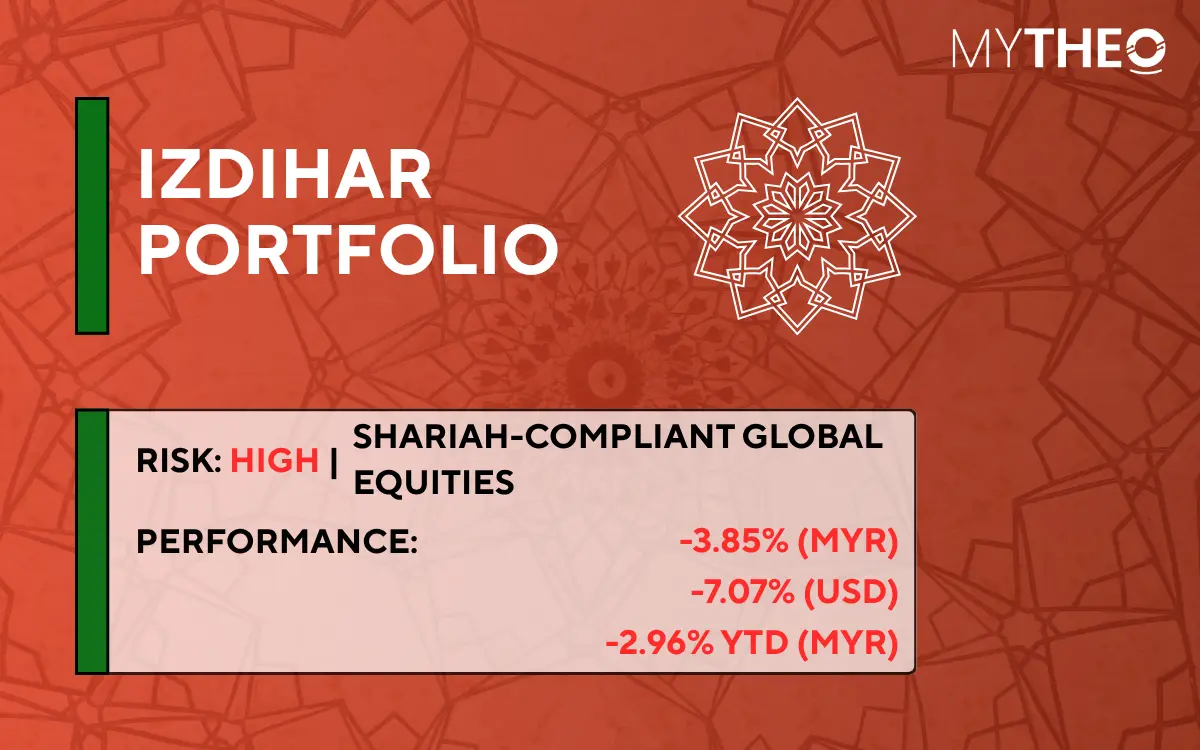
*YTD = Year to Date
*Source: GAX MD Sdn Bhd, data in USD term for the month of March 2026
Past performance is not an indication of future performance.
YTD PORTFOLIO RETURN IN % (MYR)
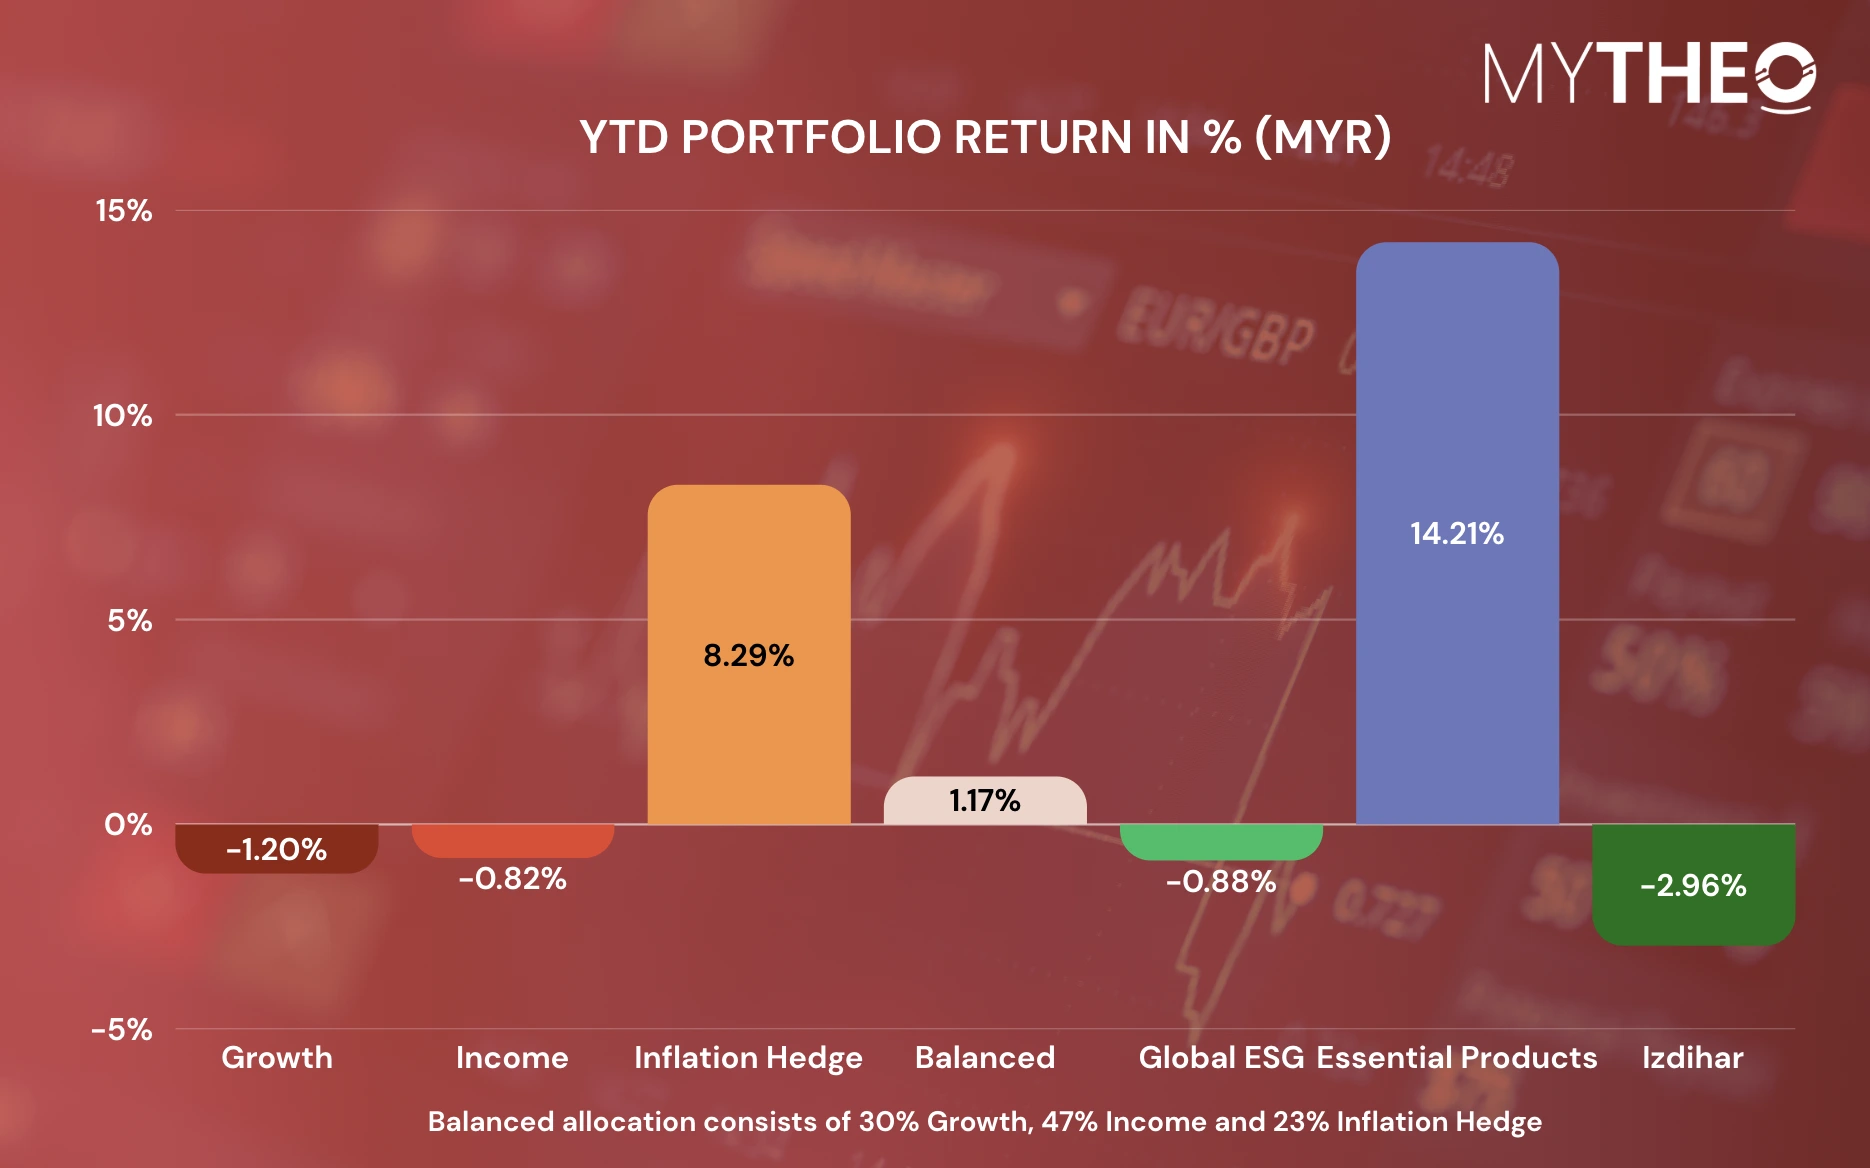
*YTD = Year to Date
Source: GAX MD Sdn Bhd, April 2026 | Past performance is not an indication of future performance.
HOW TO CALCULATE YOUR OMAKASE RETURNS
Your Omakase return is the weighted sum of each portfolio's monthly return. Using the balanced allocation as an example:
For instance, assuming allocations of 30% to the Growth portfolio, 47% to the Income portfolio and 23% to the Inflation Hedge Portfolio, the YTD portfolio return in MYR as of February would be 1.74%. [(30% x 1.38%) + (47% x -2.05%) + (23% x 10.17%)]
Your actual return varies based on your personal allocation and investment timing.
CIO Commentary
March was defined by a single dominant force: the escalation of the conflict involving Iran. This rapidly became the primary driver of global markets, overriding traditional economic data. Investor behaviour shifted decisively toward risk aversion, driven by concerns over potential disruptions to the Strait of Hormuz—one of the world’s most critical energy supply routes.
1. Energy and Currency Movements
Oil markets responded with immediate volatility. West Texas Intermediate (WTI) surged by 51% during the month as markets began pricing in the risk of severe supply shocks. Higher energy prices feed directly into inflation expectations, particularly for import-dependent nations.
Simultaneously, the US Dollar strengthened by 3.81%, reflecting a classic flight to safety. The combination of soaring oil prices and a strengthening US Dollar has reintroduced concerns regarding renewed global inflation, complicating the outlook for central banks worldwide.
2. Equity Market Performance
Global equity markets struggled to absorb the shock, though the impact was geographically uneven:
- Asia: Regional markets were hit the hardest. South Korea, Taiwan, Japan, and India led the decline. This was driven by a combination of profit-taking (following a strong late-2025 rally) and the region’s structural dependence on Middle Eastern energy imports.
- United States: The US market demonstrated relative resilience. As a net energy exporter, the US is less exposed to physical supply disruptions, although higher oil prices still present medium-term inflationary risks to the domestic economy.
3. Portfolio Performance
The shift toward risk aversion created a challenging environment for equity heavy such as Growth, ESG, and Izdihar.
In Ringgit terms, our ESG and Izdihar portfolios declined by more than 3%. This was largely due to their concentrated exposure to Asian cyclicals, specifically in the semiconductor and manufacturing hubs of South Korea and Taiwan.
In contrast, the Growth Portfolio proved more resilient. Its strategic allocation to value-tilted strategies (such as VTV and VOE) provided a defensive buffer. These exposures favour sectors like Financials, Utilities, and Healthcare, which typically weather geopolitical storms better than high-growth tech. Furthermore, a 7.5% to 10% direct exposure to the Energy sector also helped offset broader equity sell-offs.
The Inflation Hedge portfolio experienced losses, primarily driven by a sharp correction in precious metals. Gold (IAU) and silver (SLV) declined following reports of significant bullion sales by the Turkish central bank in March. Global real estate (RWX) also came under pressure due to expectations of higher interest rates that reduced the relative attractiveness of Real Estate Investment Trusts (REITs).
However, these declines were partially offset by strong performance in other segments. Crude oil exposure (DBO) surged 36.22%, while agriculture (DBA) gained 5.00% on expectations of fertilizer shortages.
Despite negative headlines and broad-based market weakness, the Income and Essential portfolios delivered positive outcomes in Ringgit terms. The Income Portfolio gained 1.25%, supported primarily by US Dollar strength, which helped offset underlying asset volatility.
Similarly, the Essential Products Portfolio ended the month in positive territory. Its strategic allocation to energy-related assets proved beneficial, with XLE gaining over 10%, while clean and wind energy exposures (ICLN and FAN) contributed also positively after posting gains of 0.38% and 1.10% respectively.
Conclusion
Markets do not always move on fundamentals; they are often dictated by sentiment. March was a clear example of how quickly geopolitical risk can reshape market behaviour and disrupt traditional asset relationships.
In such environments, equity-heavy portfolios are naturally more exposed to downside pressure. However, our broader systematic approach which built on managing volatility rather than chasing headlines allowed our portfolios to adjust without the interference of human bias. This ensured that while certain segments faced headwinds, others were positioned to capture emerging opportunities.
Also, the divergence in performance this month highlights a critical reality: global shocks do not impact all assets equally. By maintaining exposure to energy, agriculture, and currency movements, we provided meaningful offsets to equity volatility.
March did not reward concentration. It rewarded balance, structure, and disciplined allocation. In an environment increasingly shaped by unpredictable macro events, this remains a critical advantage.
Ready to explore how MYTHEO works for your goals? Learn more here.
Or download our app so you can start investing in a moment. Download on iOS here or Android here.
*Past performance is not indicative of future results. All investments involve risk, including possible loss of principal.
This material is subject to MYTHEO’s Notice and Disclaimer.