Key Takeaways
- Technology and AI-related investments faced a sharp reversal, as concerns over escalating capital expenditure, geopolitical uncertainty, and the unwinding of crowded positions triggered a broad sell-off, particularly across Asian technology markets.
- Energy emerged as the clear winner, with rising geopolitical tensions driving crude oil prices sharply higher, while clean energy and related supply chain beneficiaries suffered steep declines as investors reassessed AI-linked growth expectations.
- Rising Treasury yields created headwinds for fixed income, weighing on long-duration government and corporate bonds, although floating-rate and senior loan exposures helped contain losses and support overall portfolio performance.
Monthly Returns Summary
The following table summarises the performance of all MYTHEO portfolios for July 2026:
1. Omakase Portfolios
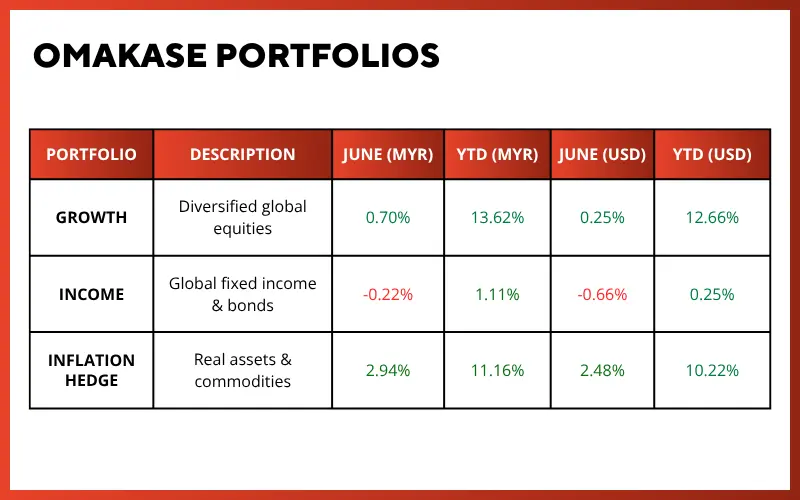
Omakase combines Growth, Income & Inflation Hedge in an optimised weightage proportion that is personalised according to your risk profile. Your return is the weighted sum of these three functional portfolios.
*Source: GAX MD Sdn Bhd, data in USD term for the month of July 2026
Past performance is not an indication of future performance.
2. Satellite Portfolios
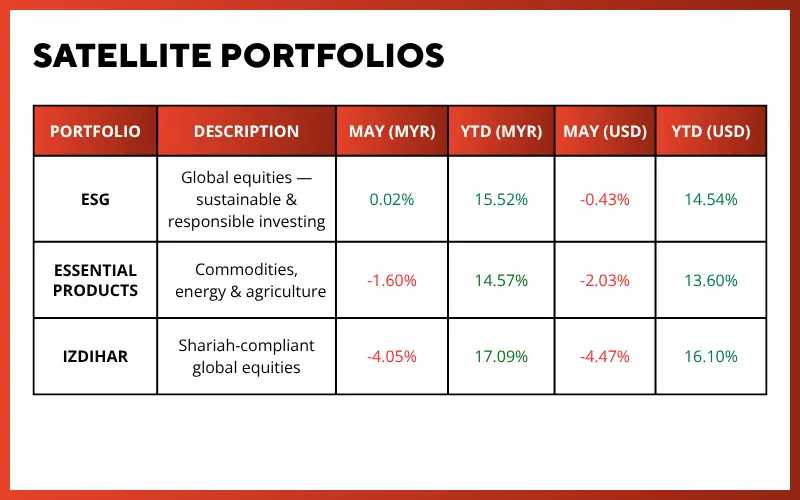
Global ESG, Essential Products, and Izdihar are standalone portfolios — each with its own investment theme. They can be held independently or alongside an Omakase allocation.
*Source: GAX MD Sdn Bhd, data in USD term for the month of July 2026
Past performance is not an indication of future performance.
3. MYTHEO Portfolio YTD Returns in MYR
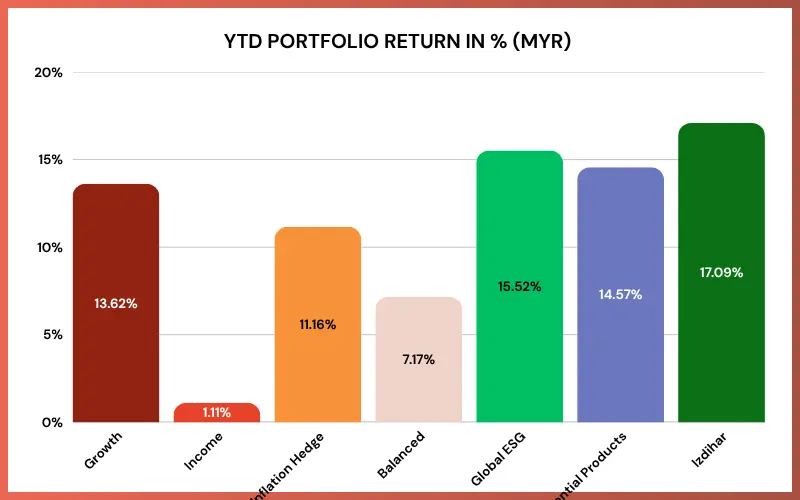
*YTD = Year to Date
*Source: GAX MD Sdn Bhd, data in USD term for the month of July 2026
Past performance is not an indication of future performance.
HOW TO CALCULATE YOUR OMAKASE RETURNS
Your Omakase return is the weighted sum of each portfolio's monthly return. Using the balanced allocation as an example:
Using the Balanced allocation as an example, with 30% Growth, 47% Income and 23% Inflation Hedge, a Balanced Omakase returned approximately 6.37% YTD in MYR as of 30 July 2026. Your actual return varies with your personal allocation and investment timing.
Your actual return varies based on your personal allocation and investment timing.
Performance Commentary
In July, investors further reduced exposure to growth and AI-driven themes, extending the rotation that began in June toward more defensive segments of the market. Sentiment deteriorated further after the fragile ceasefire between the United States and Iran collapsed on July 7, reigniting geopolitical concerns and adding uncertainty to an already cautious investment environment.
At the same time, investors grew increasingly uneasy about the substantial capital spending commitments announced by major technology companies. Concerns over whether these investments would generate sufficient returns triggered a broad sell-off across the technology sector. Asian technology stocks suffered even more severe declines, as many positions had been accumulated using margin financing, resulting in a wave of forced selling and margin calls.
Amid the volatility, crude oil emerged as the standout performer. The Invesco DB Oil Fund (DBO) surged 21.98% during the month, making it one of the strongest-performing assets across global markets.
1. AI and Technology Trade Unravels
MYTHEO Izdihar was the weakest-performing portfolio during the month, as every ETF within the portfolio ended in negative territory. The broad-based technology sell-off weighed heavily on portfolio holdings, particularly those tied to growth and innovation themes.
In contrast, the MYTHEO Growth and ESG portfolios managed to remain slightly positive in MYR despite the challenging backdrop. Losses in technology, particularly within Asia, were offset by strong performances in markets outside the United States (US) as well as value-oriented and mid-capitalization strategies.
The resilience of the Growth and ESG portfolios reflected a common theme: exposure to value-oriented and less technology-heavy assets helped cushion the impact of the broader growth sell-off. Within the Growth Portfolio, UK equities (EWU), Canadian equities (EWC), and mid-cap value stocks (VOE) provided positive contributions.
In the ESG Portfolio, gains from US large-cap value stocks (NULV), which rose 3.40%, and developed market equities outside the US and Canada (ESGD), which gained 1.84%, helped offset losses from growth-oriented holdings such as ESGE, NULG, and NUMG.
2. Oil Rallies on Geopolitical Tensions but Clean Energy Is Hit by the Technology Sell-Off
The Inflation Hedge portfolio gained 2.94%, supported by strong performance in crude oil exposure, with DBO rising sharply by 21.98%. In contrast, the Essential Products portfolio declined by 1.60%, weighed down by steep losses in clean energy stocks. Clean energy, represented by ICLN, fell 14.35% during the month as weakening sentiment toward AI-related investments spread across the broader technology supply chain.
The Essential Products portfolio was also affected by weakness in other renewable energy segments. Global lithium exposure through LIT declined 11.57%, while wind energy (FAN) fell by approximately 5%, further weighing on overall portfolio performance.
3. Rising Treasury Yields Challenge Fixed Income Markets
The Income Portfolio recorded a modest loss of 0.22% during the month as rising bond yields pressured both government and corporate fixed income securities.
The surge in crude oil prices following the collapse of the US-Iran ceasefire revived concerns that inflationary pressures could re-emerge, leading investors to reassess the outlook for future US interest rates. Consequently, the yield on the US 10-year Treasury climbed to 4.745%, its highest level since October 2023.
Higher yields negatively impacted long-duration assets, particularly US Treasury bonds with maturities exceeding 20 years (TLT) and investment-grade corporate bonds (LQD), both of which are highly sensitive to interest rate movements.
Despite these headwinds, losses within the Income Portfolio were largely contained by positive contributions from senior loans (SRLN), international government bonds (BWX), and floating-rate bonds (FLOT). Both SRLN and BWX were less sensitive to changes in US interest rates than long-duration US Treasuries and investment-grade corporate bonds, helping to reduce the portfolio's exposure to rising domestic yields.
Meanwhile, floating-rate bonds (FLOT) benefited from their variable coupon structure, where interest payments adjust in line with prevailing short-term rates. This allowed investors to earn higher income as US yields rose, helping cushion the impact of higher treasury yields.
4. Conclusion
AI and technology have been major sources of returns for investors in recent years. However, since June, investors moved away from technology, AI, and other high-growth segments in response to geopolitical tensions, elevated valuations, and questions around the sustainability of aggressive capital spending plans. This shift led to broad-based weakness across technology-related sectors and also affected adjacent themes such as clean energy and data center infrastructure.
At the same time, energy markets benefited from renewed supply concerns following the collapse of the US-Iran ceasefire, with crude oil delivering one of the strongest performances across global asset classes. Rising oil prices also rekindled inflation concerns, pushing treasury yields higher and creating a more challenging environment for fixed income investors.
Despite the weakness in technology, not all MYTHEO portfolios were affected. While exposure to large technology companies has been an important driver of returns, MYTHEO portfolios are not solely dependent on technology. Exposure to value-oriented strategies, international equities, energy-related assets, and floating-rate fixed income helped cushion losses in areas most affected by the market shift. More importantly, MYTHEO's core investment engine uses risk-based algorithms to monitor market data and automatically adjust portfolios as conditions change, helping investors navigate shifts caused by geopolitics, inflation, and corporate spending trends. As July demonstrated, market momentum can shift quickly, and portfolios supported by multiple return drivers are better positioned to navigate periods of uncertainty.
Appendix
ETF Performance Summary by Portfolio | July 2026
1. Growth Portfolio
RISK: HIGH | Diversified global equities
2. Income Portfolio
RISK: LOW | Global fixed income & bonds
3. Inflation Hedge Portfolio
RISK: MEDIUM | Real assets & commodities
4. ESG Portfolio
RISK: HIGH | Global equities — sustainable & responsible investing
5. Essential Products Portfolio
RISK: HIGH | Commodities, energy & agriculture
6. Izdihar Portfolio
RISK: HIGH | Shariah-compliant global equities
*Returns are in USD terms for the month of July 2026.
Top and Bottom performers ranked by 1-month return within each portfolio. Past performance is not indicative of future results.
Ready to explore how MYTHEO works for your goals? Learn more here.
Or download our app so you can start investing in a moment. Download on iOS here or Android here.
*This material is subject to MYTHEO's Notice and Disclaimer. All performance figures are net of management fees.
Past performance is not indicative of future results.
This material is subject to MYTHEO’s Notice and Disclaimer.