Tuesday, 05 January 2021
Written by Marc Chow, Head of Business Development & Partnerships of GAX MD

There were comments relating to investments on the news and social media as a result of the US Presidential Elections. Some of these comments in investing forums were about general themes such as:
1. How will the market react after the US Presidential Elections?
2. Is it better to sell off my investments and wait until after the elections to begin reinvesting?
3. What are other investors doing to prepare for a potential market sell down after the elections?
It is rather unfortunate, but judging from the responses, there seemed to be a select few who advocated for others to sell off their investments, hold cash and adopt a wait-and-see approach before they begin investing again. This phenomenon is otherwise known as trying to ‘Time the Market’.
While we do note that there are certain benefits to timing the market, this article is written with the hope of presenting a different approach and to advocate the other phenomenon, also known as ‘Time in the Market’ which argues for very basic and fundamental investment practices such as investing early, adopting a long-term approach and being patient with your investments.
Time in the Market is key
Sam and Jack each invested $30,000 every year on January 1—regardless of whether the market was up or down. But Sam started 20 years ago, whereas Jack started only 10 years ago. Although they each invested a total of $30,000, by 2017 Sam had about $30,000 more because he was in the market longer. This is not rocket science, as Sam’s end value would have been a result of having the benefit of time to allow his returns to compound over a 20-year period.
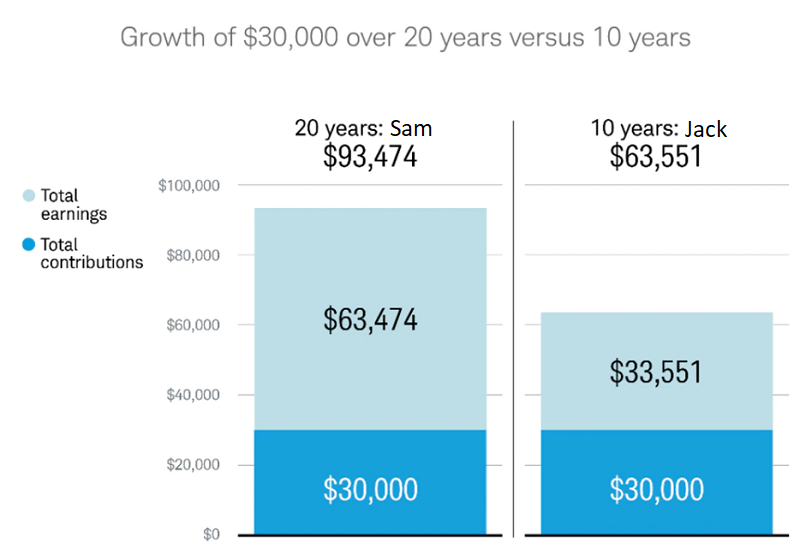
Source: Schwab Center for Financial Research with data from Morningstar. The hypothetical portfolio is invested entirely in the S&P 500® Index from 1 January 1998–31 December 2017 for Sam, and from 1 January 2008–31 December 2017 for Jack. The end amount includes capital appreciation and dividends. Dividends are assumed to be reinvested when received. Fees and expenses would lower returns. Jack's average annual rate of return is 6.9%; Sam's is 7.7%. The actual rate of return will fluctuate with market conditions. Past performance is no indication of future results.
Indexes are unmanaged, do not incur management fees, costs and expenses, and cannot be invested in directly.
Predicting Market Highs and Market Lows
To quote Peter Lynch, an American investor, mutual fund manager and philanthropist: Far more money has been lost by investors preparing for corrections, or trying to anticipate corrections, than has been lost in corrections themselves. This describes the investor behaviour that was mentioned above, with some investors trying to advocate for others to hold cash and to try and time the market.
According to Charles Schwab, many investors were tempted to get out of the market during the market lows in 2009 — but investors withdrew at their peril. For example, if you had invested $100,000 on 1 January 2009 but missed the top 10 trading days, you would have had $43,000 less by the end of the year than if you’d stayed invested the whole time. This is further described by the chart below.
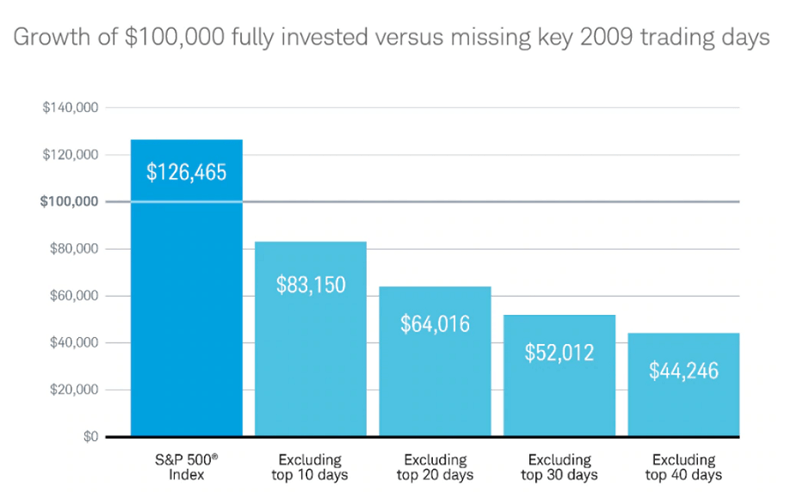
Source: Schwab Center for Financial Research with data from Morningstar. The year begins on the first trading day in January and ends on the last trading day of December, and daily total returns were used. Returns assume reinvestment of dividends. Fees and expenses would lower returns. When out of the market, cash is not invested. Market returns are represented by the S&P 500 Index, an index of widely traded stocks. Top days are defined as the best performing days of the S&P 500 during 2009. This chart represents a hypothetical investment and is for illustrative purposes only. Past performance is no indication of future results.
By staying fully invested in the S&P 500 Index in 2009, investors who invested $100,000 would have experienced profits of $26,465. Whereas an investor who withdrew their investments and waited for 10 days, would have only $83,150 left having lost $16,850 in trying to time the market. The chart further explains what would happen to an investor who withdrew their investments and waited for 20 days, 30 days and 40 days.
Conclusion
We hope that the two points presented above will help present a different view and approach to all investors as well as provide information on the benefits of having ‘Time in the Market’ vs trying to ‘Time the Market’. While timing the market may have certain benefits as well, we hope our investors will make informed investment decisions at all times.
MYTHEO, as a digital investment management service, takes a disciplined investment approach by investing for the long term, implementing passive management, avoiding market timing and diversifying across multiple asset classes. In addition, MYTHEO’s regular savings plan enables investors to increase ‘Time in the Market’ by investing consistently.
So do take advantage of MYTHEO’s features to achieve your investment goals. Till then, happy investing.