13 February 2026
Written by MYTHEO
Key Takeaways
- While US mega-caps delivered mixed results, global semiconductor leaders in Korea and Taiwan drove strong gains across Growth, ESG, and Shariah portfolios, validating MYTHEO’s diversified global allocation approach.
- Gold, silver, oil, and essential sectors delivered some of the strongest performances since portfolio inception, proving that disciplined inflation and real-asset exposure can turn uncertainty into opportunity.
- January demonstrated how diversified exposure across regions, asset classes, and risk drivers can generate resilient returns even when currency moves and headline risks appear unfavorable.
1. Growth Portfolio
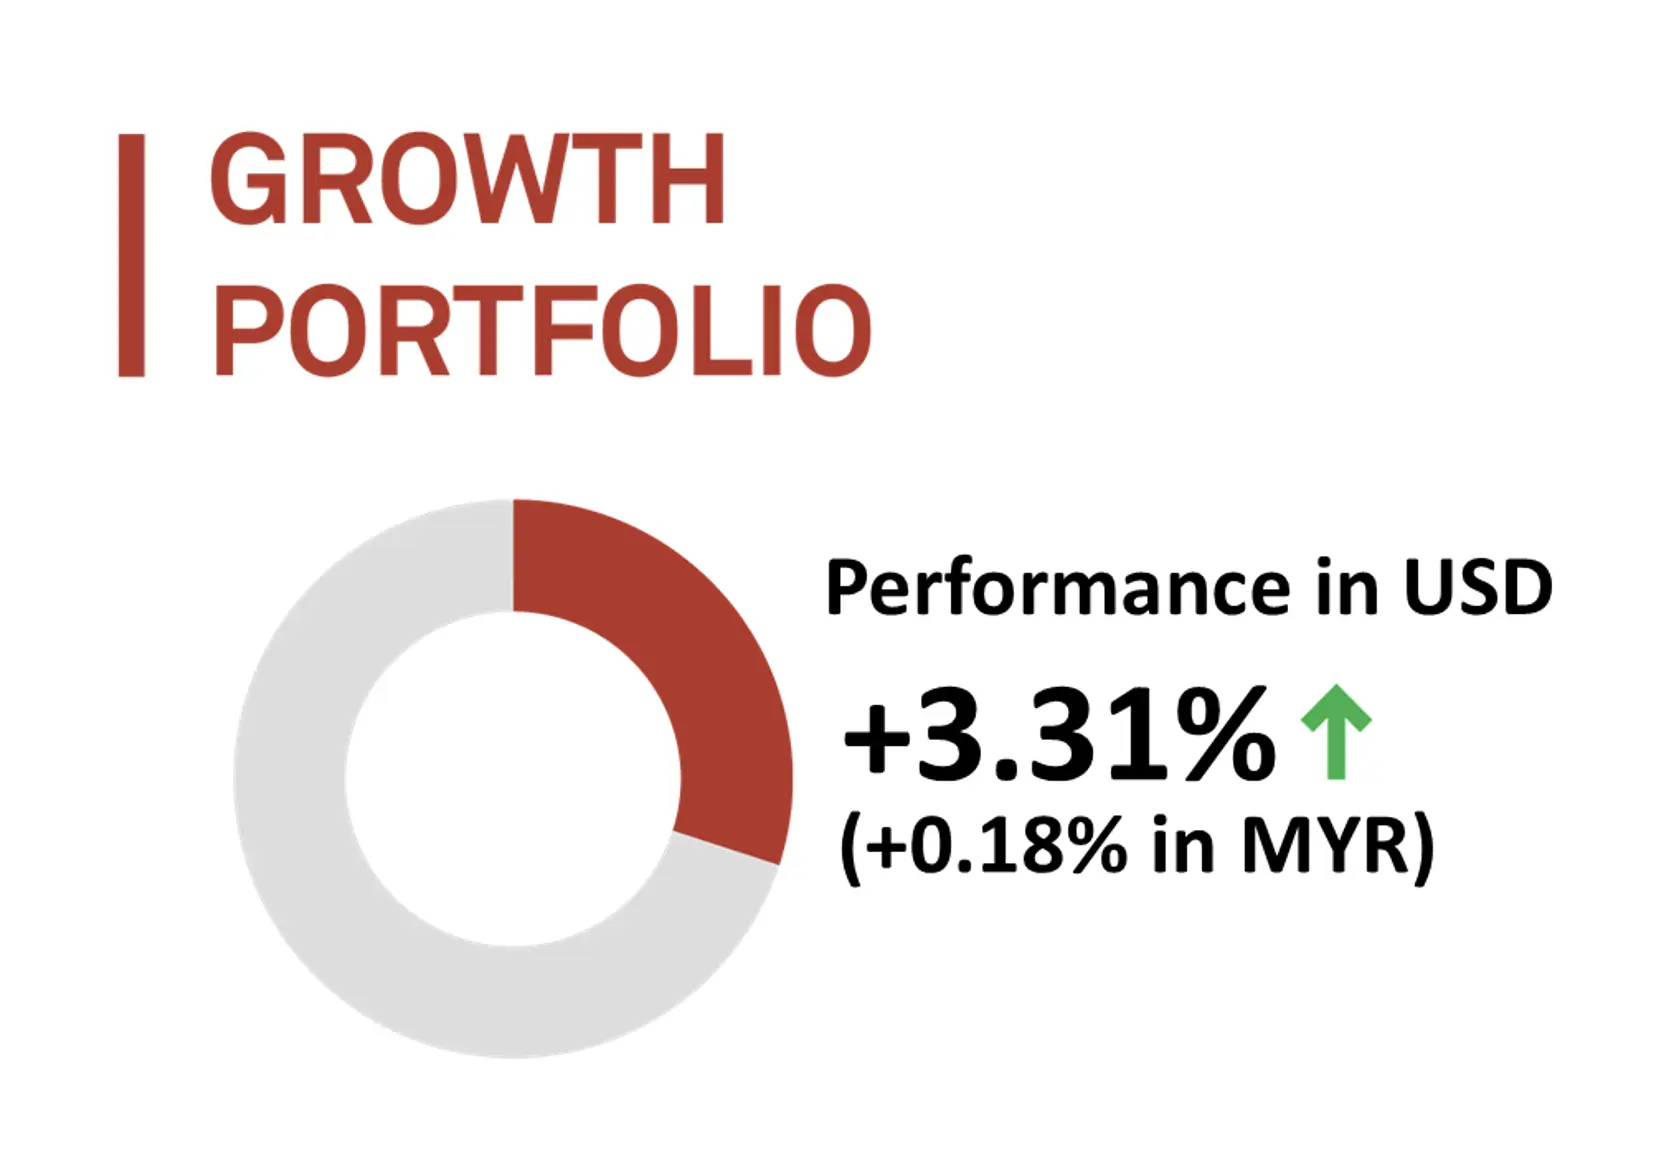
The Growth Portfolio began 2026 on a strong footing, extending its winning streak to nine consecutive months in US Dollar terms. Performance was driven by broad strength in the Pacific (VPL) and Emerging Markets (VWO).
Pacific equities benefited primarily from a sharp rally in South Korea, one of the largest country exposures within the market. The KOSPI Index surged by nearly24% in January, driven by renewed optimism around the semiconductor cycle where Samsung Electronics and SK Hynix rallied by 33.9% and 39.6% respectively.
Emerging Markets (VWO) also posted robust gains, supported by strong performances acrossBrazil and Taiwan. Brazil rallied 12.56%, buoyed by rising commodity pricesthat lifted market sentiment. Taiwan advanced by 10.70%, led by TaiwanSemiconductor Manufacturing Company (TSMC), which rose more than 8.78% duringthe month. TSMC represents over 10% of the emerging market exposure, making itthe single largest contributor to VWO performance.
The only detractor for the month was US large-cap growth exposure (VUG). While overallUS technology results were mixed, an 11.03% decline in Microsoft weighed on the sector. This reflected a broader sell-off across software companies as investors weighed concerns that emerging AI technologies could disrupt traditional business models and erode long-term competitive advantages.
Top 3 ETFs performance (Growth portfolio)
VANGUARD FTSE PACIFIC (VPL)
VANGUARD FTSE EMERGING MARKETS (VWO)
ISHARES MSCI UNITED KINGDOM (EWU)
+9.30%
+5.04%
+4.96%
Bottom 3 ETFs performance (Growth portfolio)
VANGUARD GROWTH INDEX FUND ETF (VUG)
ISHARESMSCI CANADA (EWC)
VANGUARD MID-CAP VALUE INDEX FUND (VOE)
-1.29%
+0.61%
+4.22%
Source: GAX MD Sdn Bhd, data in USD term for the month of January 2026
2. Income Portfolio
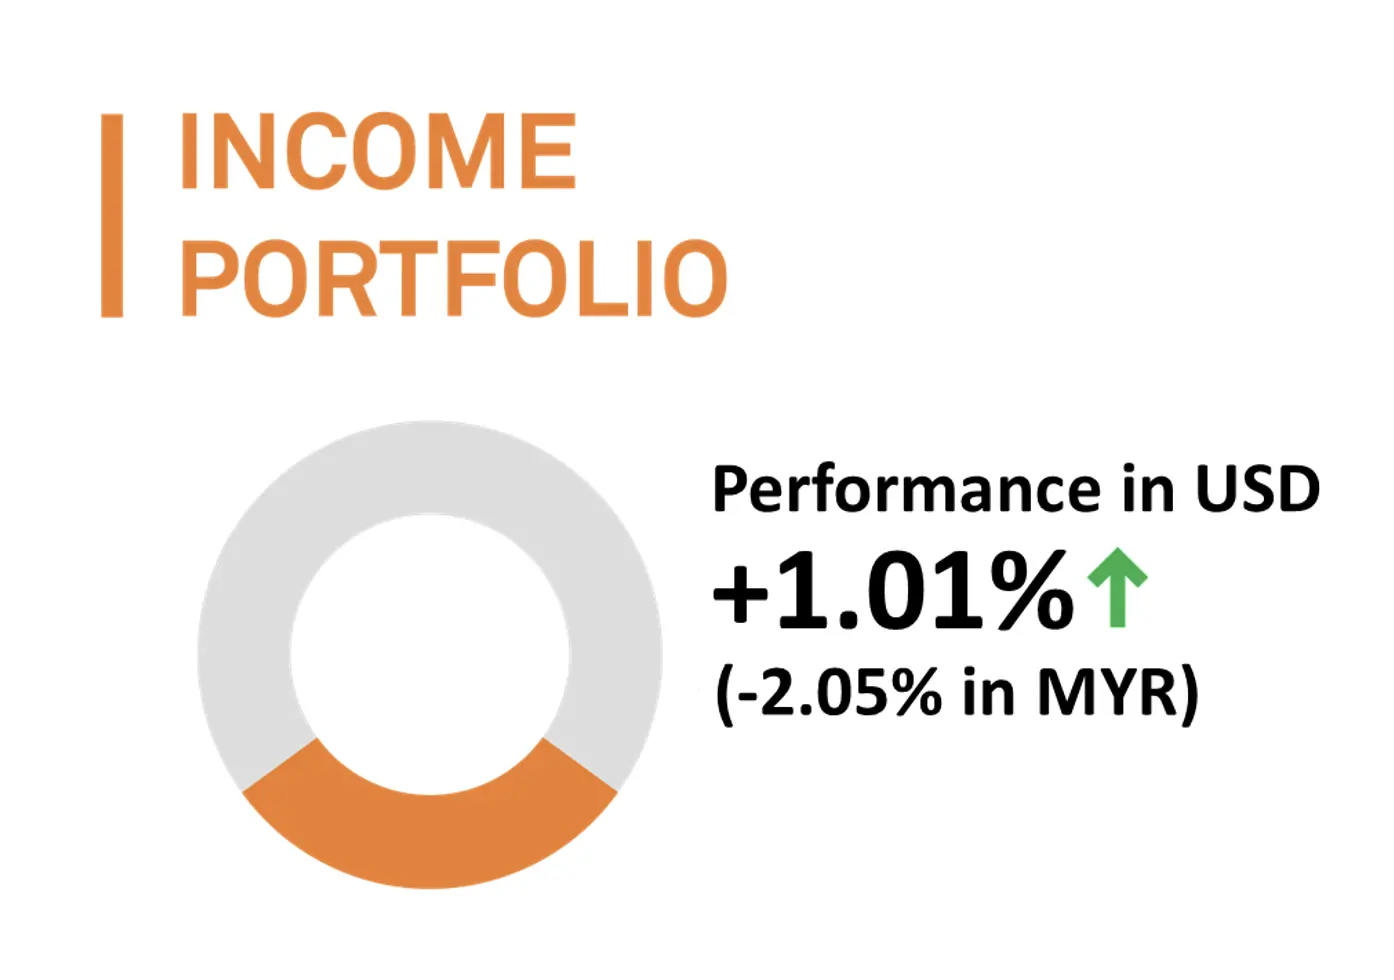
In January 2026, the MYTHEO Income Portfolio recorded a positive return in USD terms but declined by 2.97% when translated in MYR due to continued strengthening of the Ringgit during the month.
Within the US, fixed income faced headwinds as the 10-year Treasury yield rose from 4.153% to 4.241%. This upward move in yields capped the upside for US assets, leading to slight declines in US Senior Loans (SRLN) and long-duration US Treasuries (TLT). However, a weaker US Dollar improved the appeal of international debt.
Emerging MarketLocal Currency Bonds (EMLC) and International Treasuries (IGOV) both delivered gains exceeding 1.86%, providing buffer for the portfolio against the volatility in the US market.
Top 3 ETFs performance (Income portfolio)
MARKET VECTORS EMERGING MARKETS (EMLC)
ISHARESINTERNATIONAL TREASURY (IGOV)
SPDRBARCLAYS INTL TREASURY (BWX)
+1.86%
+1.80
+1.38%
Bottom 3 ETFs performance (Income portfolio)
SPDRBLACKSTONE/GSO SENIOR LOAN (SRLN)
ISHARES20+ YEAR TREASURY BONDS (TLT)
ISHARES3-7 YEAR TREASURY BONDS (IEI)
-0.75%
-0.03%
0.00%
Source: GAX MD Sdn Bhd, data in USD term for the month of January 2025.
3. Inflation Hedge Portfolio
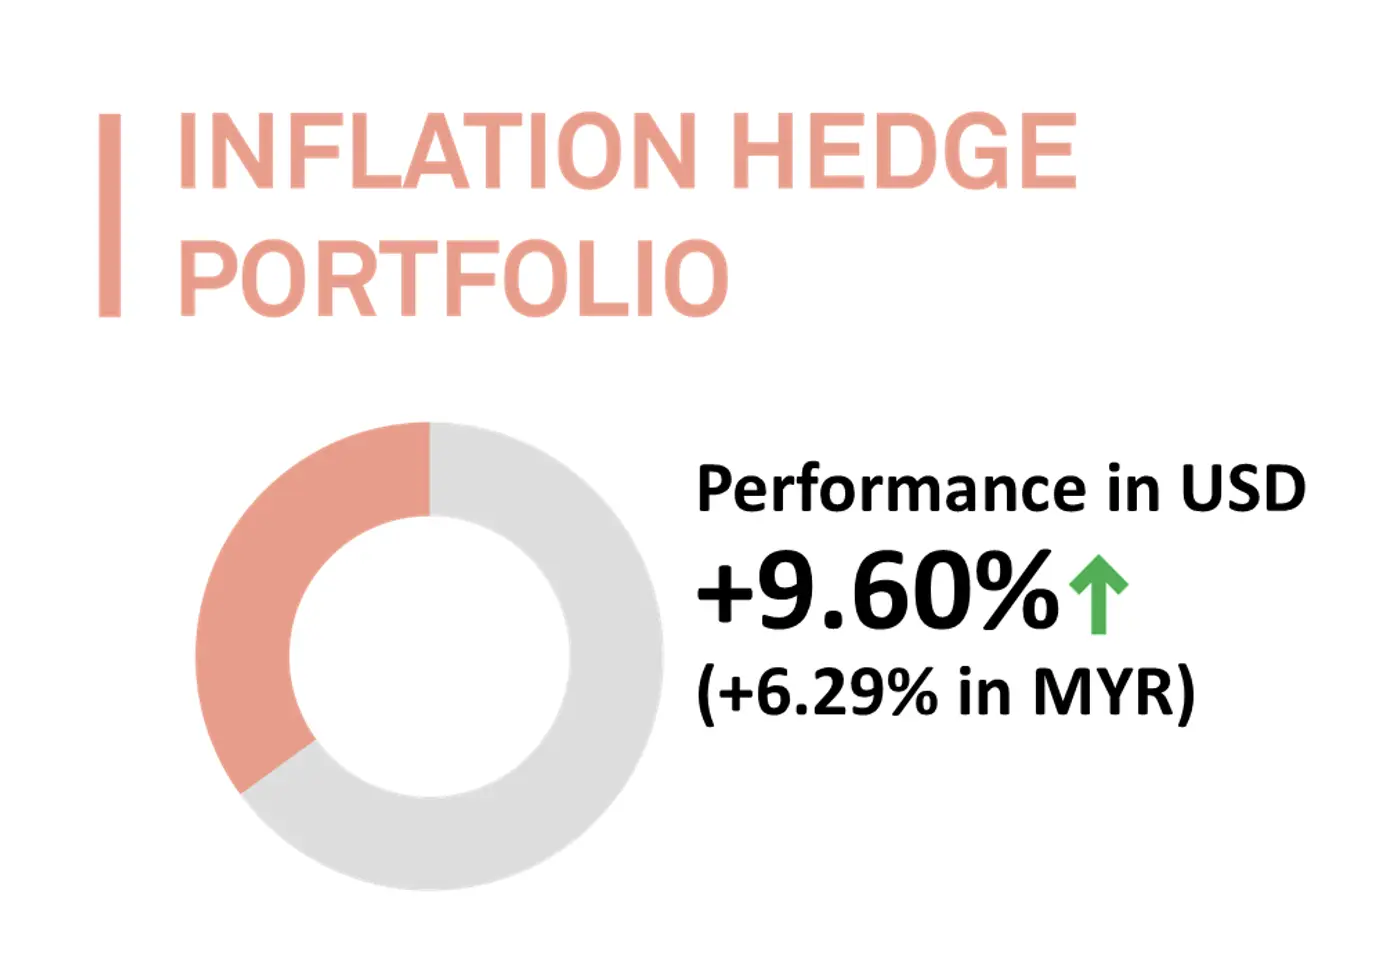
The Inflation Hedge Portfolio achieved an outstanding performance in January 2026, recording a gain of 9.60% in US Dollars and 6.29% in Ringgit. This marked the portfolio’s strongest month since its launch in May 2019.
The key driver behind this robust result was the increase in geopolitical tensions, particularly due to escalating risks in the Middle East.
As a result, precious metals acted as traditional safe havens, with silver (SLV) soaring by 17.11% and gold (IAU)advancing by 12.36%. At the same time, the energy sector experienced a notable turnaround, with crude oil exposure (DBO) climbing 15.00% for the month, rebounding from a weak 2025.
Top 3 ETFs performance (Inflation hedge portfolio)
ISHARES SILVER TRUST (SLV)
INVESCO DB OIL FUND (DBO)
ISHARES GOLD TRUST (IAU)
+17.11%
+15.00%
+12.36%
Bottom 3 ETFs performance (Inflation hedge portfolio)
ISHARES TIPS BOND ETF (TIP)
INVESCO DB
AGRICULTURE F (DBA)
ISHARES US REAL ESTATE ETF (IYR)
+0.52%
+0.55%
+2.47%
Source: GAX MD Sdn Bhd, data in USD term for the month of January 2026.
4. Global ESG Portfolio
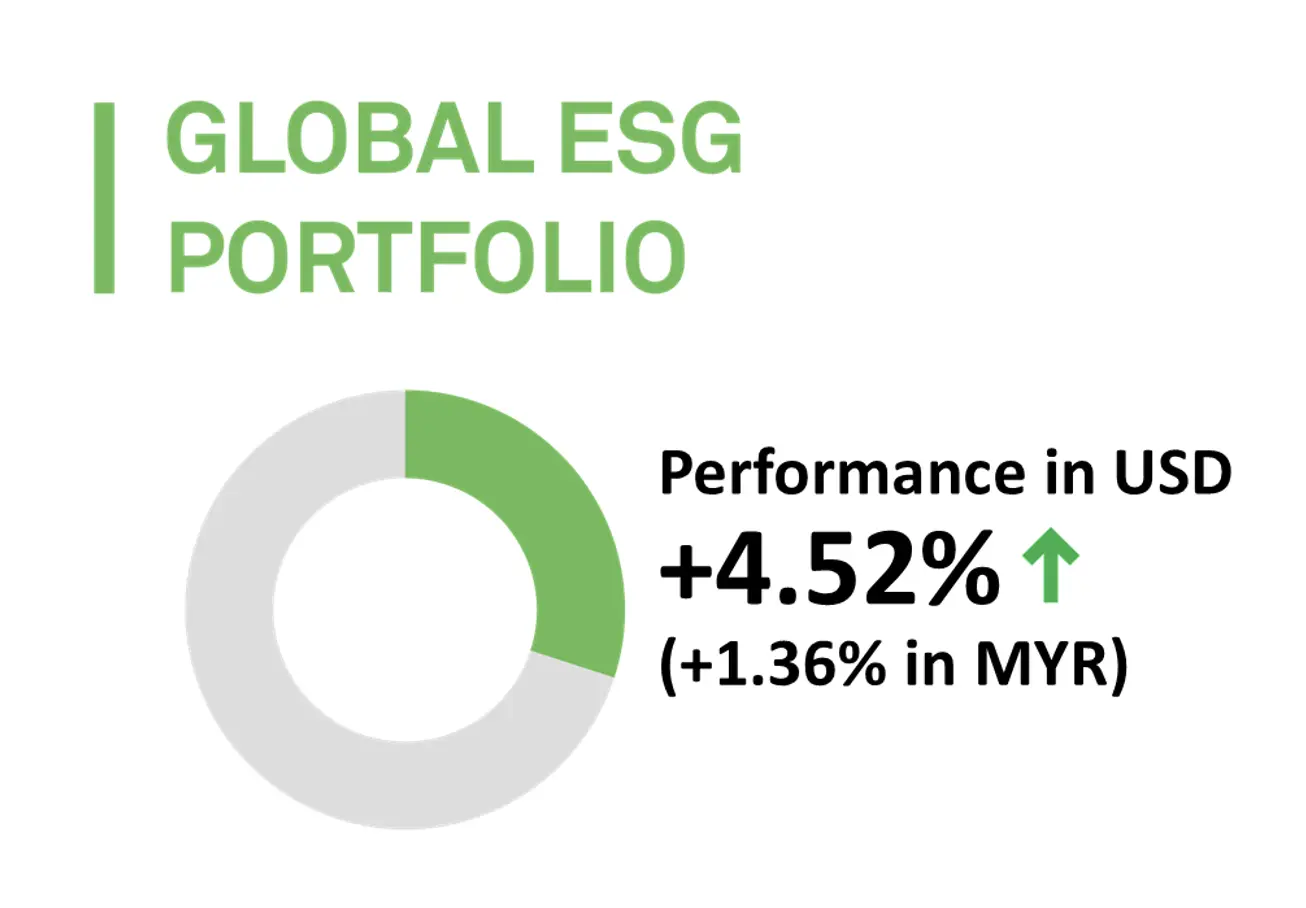
The Global ESG Portfolio achieved a gain of 4.52% in US Dollar terms during the month. However, currency movements reduced the return when measured in Malaysian Ringgit, resulting in a moderated gain of 1.36%. Overall, the portfolio’s performance was strong, as all assets delivered positive returns for the month, with none recording negative performance.
Emerging Market ESG (ESGE) was the leading contributor, posting a 7.63% gain. This outperformance was driven by favorable macroeconomic conditions across Asia. The portfolio’s significant allocation to semiconductor industry leaders in Taiwan and South Korea provided a substantial boost throughout the month.
Exposure to developed marketESG assets outside the US and Canada (ESGD) also contributed positively, benefiting from a rally in semiconductor stocks. This was highlighted by a 31.93% increase in share price for ASML, a leading Dutch semiconductor equipment manufacturer. In the US, ESG large-cap “value” stocks performed well, with Alphabet Inc. delivering a notable gain of 7.99% and further supporting portfolio returns.
Top 3 ETFs performance (Global ESG portfolio)
ISHARES ESG AWARE MSCI EM ETF (ESGE)
ISHARES ESG AWARE MSCI EAFE ETF (ESGD)
NUVEEN ESG LARGE-CAP VALUE ETF (NULV)
+7.63%
+5.07%
+4.26%
Bottom 3 ETFs performance (Global ESG portfolio)
NUVEEN ESG LARGE-CAP GROWTH ETF (NULG)
ISHARES ESG AWARE MSCI USA ETF (ESGU)
ISHARES MSCI USA ESG SELECT ETF (SUSA)
+0.04%
+1.20%
+1.31%
Source: GAX MD Sdn Bhd, data in USD term for the month of January 2026
5. Essential Products Portfolio
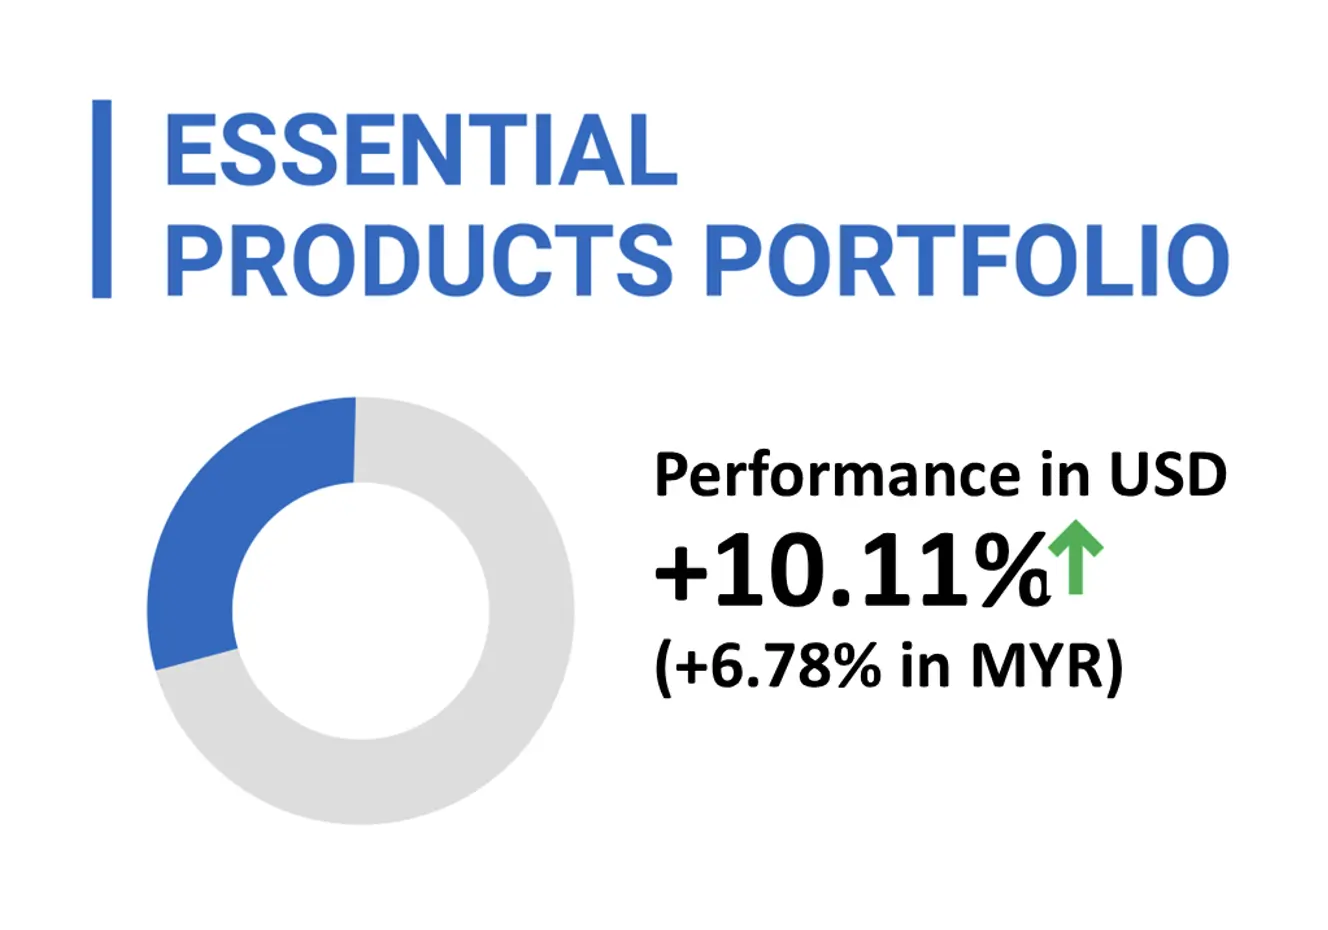
The Essential Products Portfolio recorded its strongest monthly performance since its inception in November 2023, posting a gain of 10.11% in USD terms. Although the appreciation of the Ringgit tempered these gains, the portfolio still achieved a robust return of 6.78% when measured in Ringgit.
Performance was underpinned by strength across the board, with every asset in the portfolio gaining at least 3.77%. Rising geopolitical risks drove sharp rallies in energy sector (XLE) and clean energy (ICLN), which gained 14.18% and 10.47% respectively.
The agriculture sector (VEGI), experienced double-digit growth of 10.34%. This was largely fuelled by a significant 13.41% increase in Deere & Company, a leading global manufacturer of agricultural machinery, which comprises more than one quarter of the sector's allocation.
Top 3 ETFs performance (Essential products portfolio)
ENERGY SELECT SECTOR SPDR (XLE)
ISHARES S&P GLOBAL CLEAN ENERGY INDEX ETF (ICLN)
ISHARES MSCI AGRICULTURE PRO (VEGI)
+14.18%
+10.47%
+10.34%
Bottom 3 ETFs performance (Essential products portfolio)
FIRST TRUST WATER ETF (FIW)
INVESCO S&P GLOBAL WATER IND (CGW)
GLOBALX LITHIUM & BATTERY T (LIT)
+3.77%
+3.95%
+7.85%
Source: GAX MD Sdn Bhd, data in USD term for the month of January 2026.
6. Izdihar Portfolio
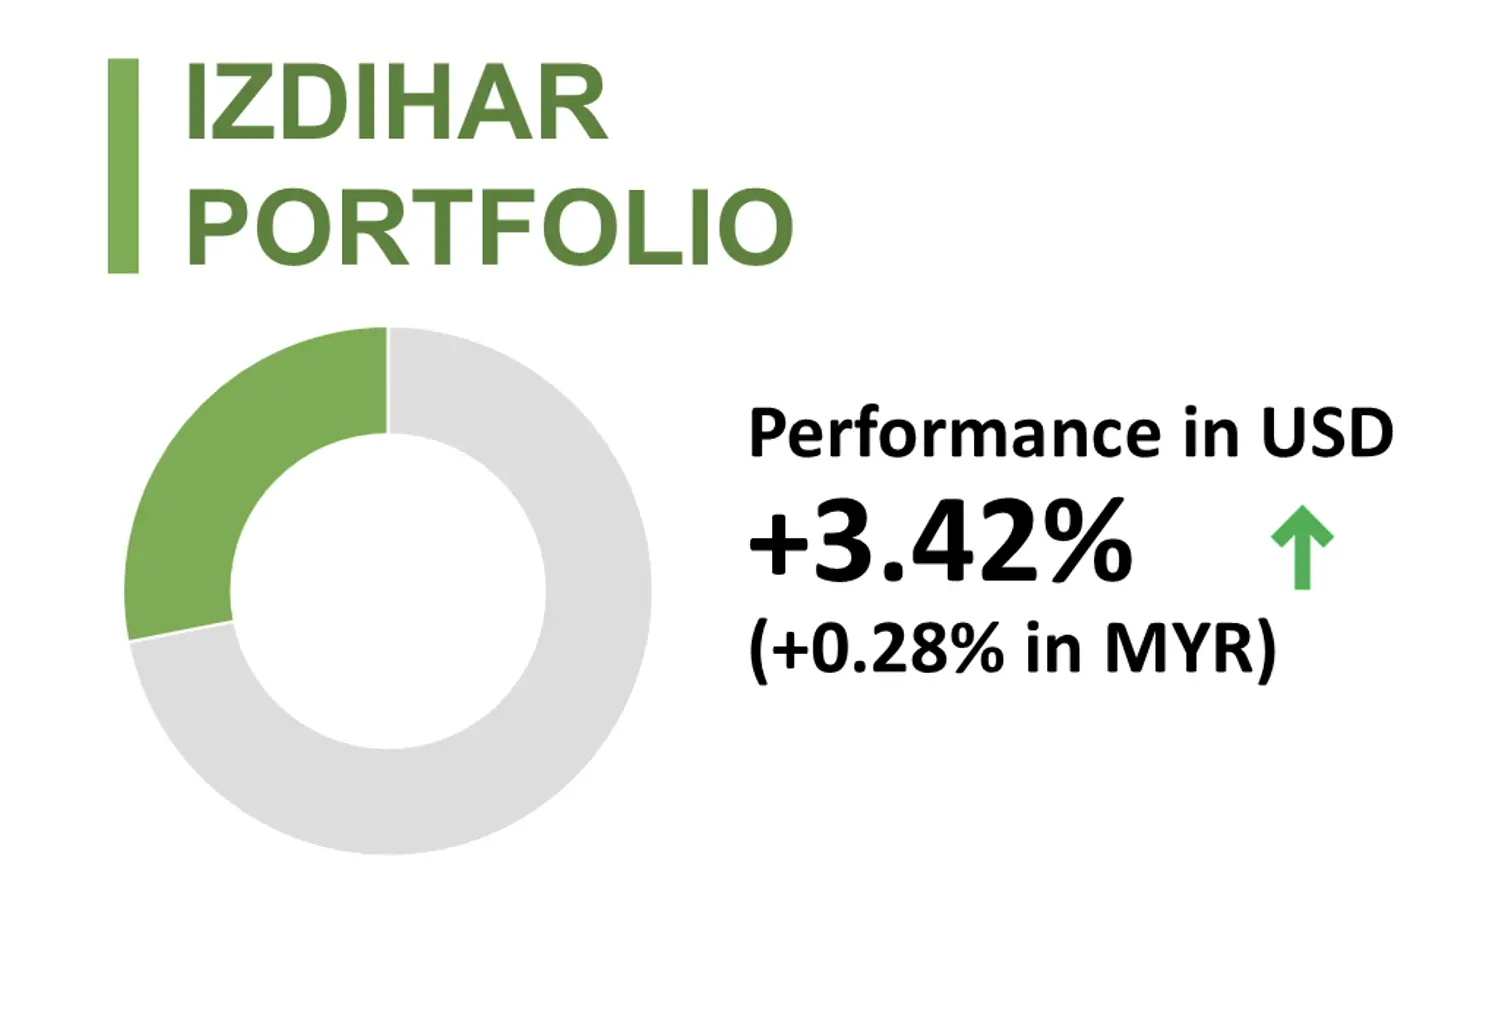
MYTHEO Izdihar rose by 3.42% in USD and 0.28% in MYR during January, despite a month in which US technology stocks delivered mixed and largely muted performance. Every asset within the portfolio closed the month with positive returns, highlighting the portfolio's resilience amid broader market volatility.
Performance was driven mainly by the portfolio’s non-US equity exposures, particularly the Wahed Dow Jones Islamic World ETF (UMMA) and the SP Funds S&P World ex-US ETF (SPWO), which rose by 7.84% and 7.46% respectively during the month. These two ETFs were the key contributors to performance, reflecting the strength of global equities outside the US.
Both UMMA and SPWO maintain substantial positions in leading global semiconductor companies outside the US. Taiwan Semiconductor Manufacturing Company (TSMC), the largest constituent in both ETFs, represents approximately 15% to 17% of their total holdings. In January, TSMC delivered an 8.78% gain.
Furthermore, the portfolios feature significant allocations to other major technology firms such as Samsung Electronics, SK Hynix, and ASML, each of which posted gains exceeding 30% during the same period. These robust performances from key semiconductor and technology holdings were instrumental in driving the overall positive returns for the Izdihar portfolio in January.
Top 3 ETFs performance (Izdihar portfolio)
WAHED DOW JONES ISLAMIC WORLD ETF (UMMA)
SP FUNDS S&P WORLD (EX-US) ETF (SPWO)
SP FUNDS S&P GLOBAL TECHNOLOGY ETF (SPTE)
+7.84%
+7.46%
+4.38%
Bottom 3 ETFs performance (Izdihar portfolio)
SP FUNDS S&P 500 SHARIA INDUSTRY EXCLUSIONS ETF (SPUS)
WAHED FTSE USA SHARIAH ETF (HLAL)
SP FUNDS S&P GLOBAL TECHNOLOGY ETF (SPTE)
+0.81%
+1.90%
+4.38%
Source: GAX MD Sdn Bhd, data in USD term for the month of January 2026.
YTD Portfolio Return in % (MYR)
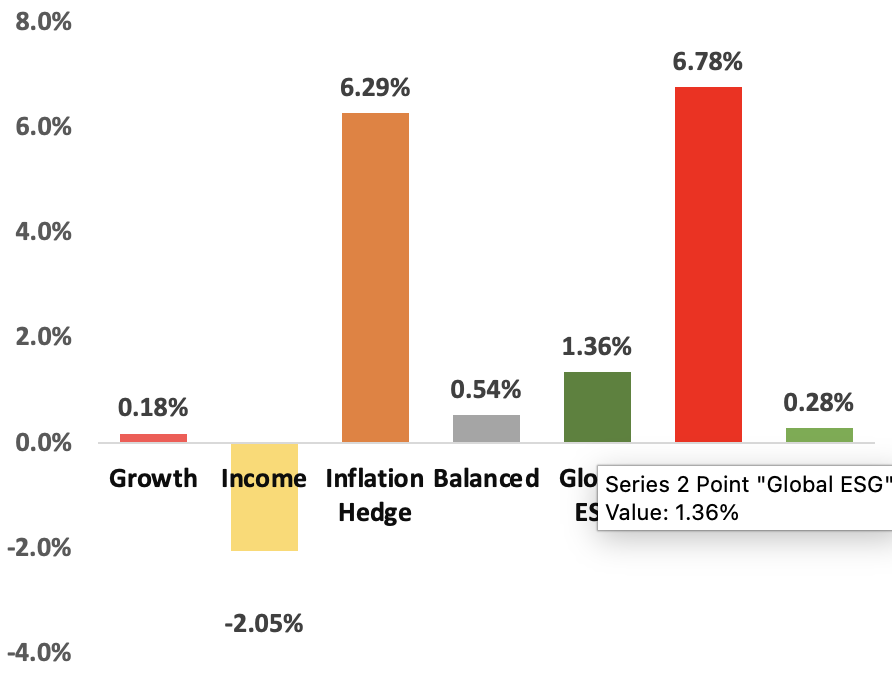
Source: GAX MD Sdn Bhd, January 2026
Note: Past performance is not an indication of future performance
Balanced allocation consists of 30% Growth, 47% Income and 23% Inflation Hedge
How to calculate MYTHEO Omakase actual monthly portfolio return
For MYTHEO Omakase, the actual portfolio returns derive from the combined weighted returns of each allocated functional portfolio.
For instance, assuming allocations of 30% to the Growth portfolio, 47% to the Income portfolio and 23% to the Inflation Hedge Portfolio, the YTD portfolio return in MYR as of January would be 0.54%. [(30% x 0.18%) + (47% x -2.05%) + (23% x 6.29%)]
Our Thoughts
January 2026 confirmed a trend that gained significant momentum throughout 2025: a decisive shift in market leadership away from the US. Non-US equities once again took the lead, with Emerging Markets and Developed Asia outperforming as investors broadened their search for technology leaders. In particular, Korea and Taiwan stood out as capital moved beyond US mega-caps to capture opportunities within the global semiconductor and AI supply chains.
Alongside this rotation, geopolitical risks returned to the headlines. Gold and silver extended their gains, building on the uncertainty that defined much of 2025. At the same time, rising tensions in the Middle East pushed oil prices sharply higher. This shifted investor focus toward the energy sector and created an environment that was exceptionally supportive for portfolios weighted toward real assets. As a result, the Inflation Hedge and Essential portfolios benefited most from these moves.
A primary concern for many investors is the impact of a weakening US Dollar on MYTHEO portfolios. While a softer greenback may appear detrimental at first glance, it often acts as a powerful tailwind for non-US exposures. It provides valuation support for international assets, which can help drive returns even when the currency conversion seems unfavorable.
The evidence of this resilience was undeniable in January. Despite the US Dollar falling below the 4.0 level for the first time since June 2018, both the Inflation Hedge and Essential portfolios recorded their strongest monthly performances since inception. This clearly demonstrates that underlying asset appreciation can effectively offset, and even overcome, currency-related headwinds.
Ultimately, January served as a reminder that MYTHEO portfolios are engineered to perform across shifting conditions. Rather than relying on a single market or currency trend, returns are driven by how diverse assets respond to changes in growth, geopolitics, and market dynamics. In this environment, factors often perceived as risks (such as geopolitical tension and currency volatility) became meaningful sources of return through disciplined, strategic positioning.
Discover how MYTHEO can enhance your portfolio diversification today and embark on your financial journey with confidence.
Find out more about MYTHEO here.
You can also download our app in iOS and Google Play.
This material is subject to MYTHEO’s Notice and Disclaimer.