Key Takeaways
- After months of technology-driven gains, investors rotated into other areas of the market. Value stocks, international equities, and selected industrial names stepped up to drive returns as major technology stocks entered a period of consolidation.
- While commodities and precious metals faced sharp corrections, strength across equities, international exposures, real estate, and fixed income helped most MYTHEO portfolios finish June in positive territory.
- The appreciation of the US dollar provided an additional tailwind for Malaysian investors, helping enhance portfolio returns in Ringgit terms.
Monthly Returns Summary
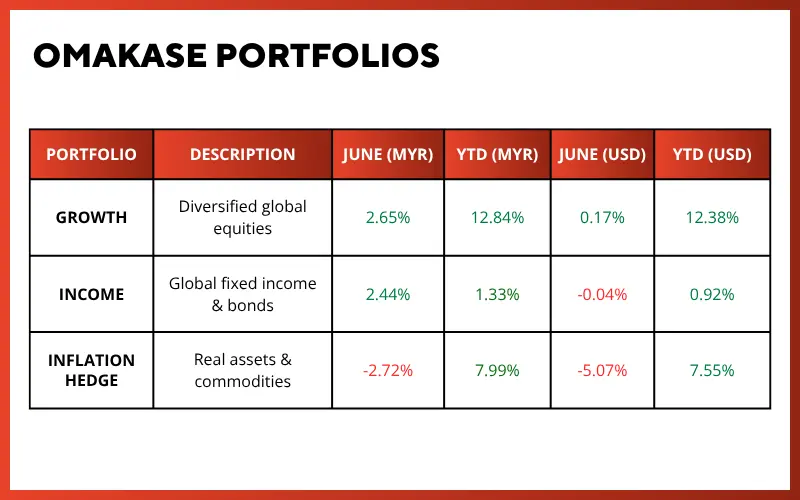
The following table summarises the performance of all MYTHEO portfolios for June 2026:
1. Omakase Portfolios
Omakase combines Growth, Income & Inflation Hedge in an optimised weightage proportion that is personalised according to your risk profile. Your return is the weighted sum of these three functional portfolios.
*Source: GAX MD Sdn Bhd, data in USD term for the month of June 2026
Past performance is not an indication of future performance.
2. Satellite Portfolios
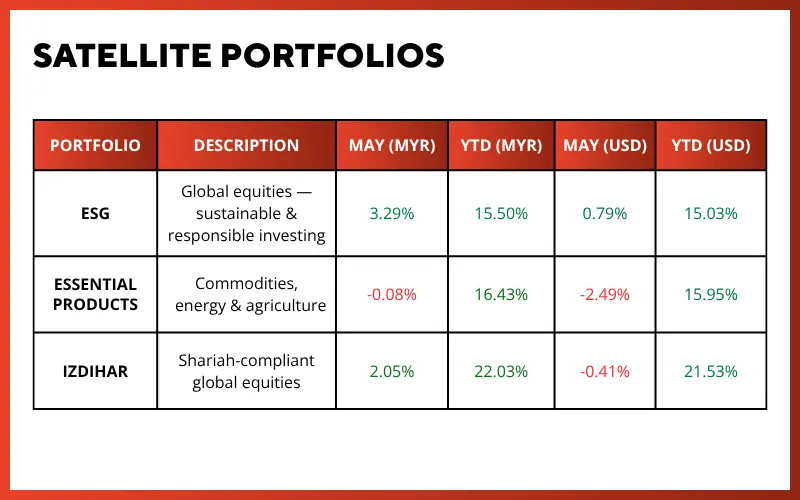
Global ESG, Essential Products, and Izdihar are standalone portfolios — each with its own investment theme. They can be held independently or alongside an Omakase allocation.
*Source: GAX MD Sdn Bhd, data in USD term for the month of June 2026
Past performance is not an indication of future performance.
3. MYTHEO Portfolio YTD Returns in MYR
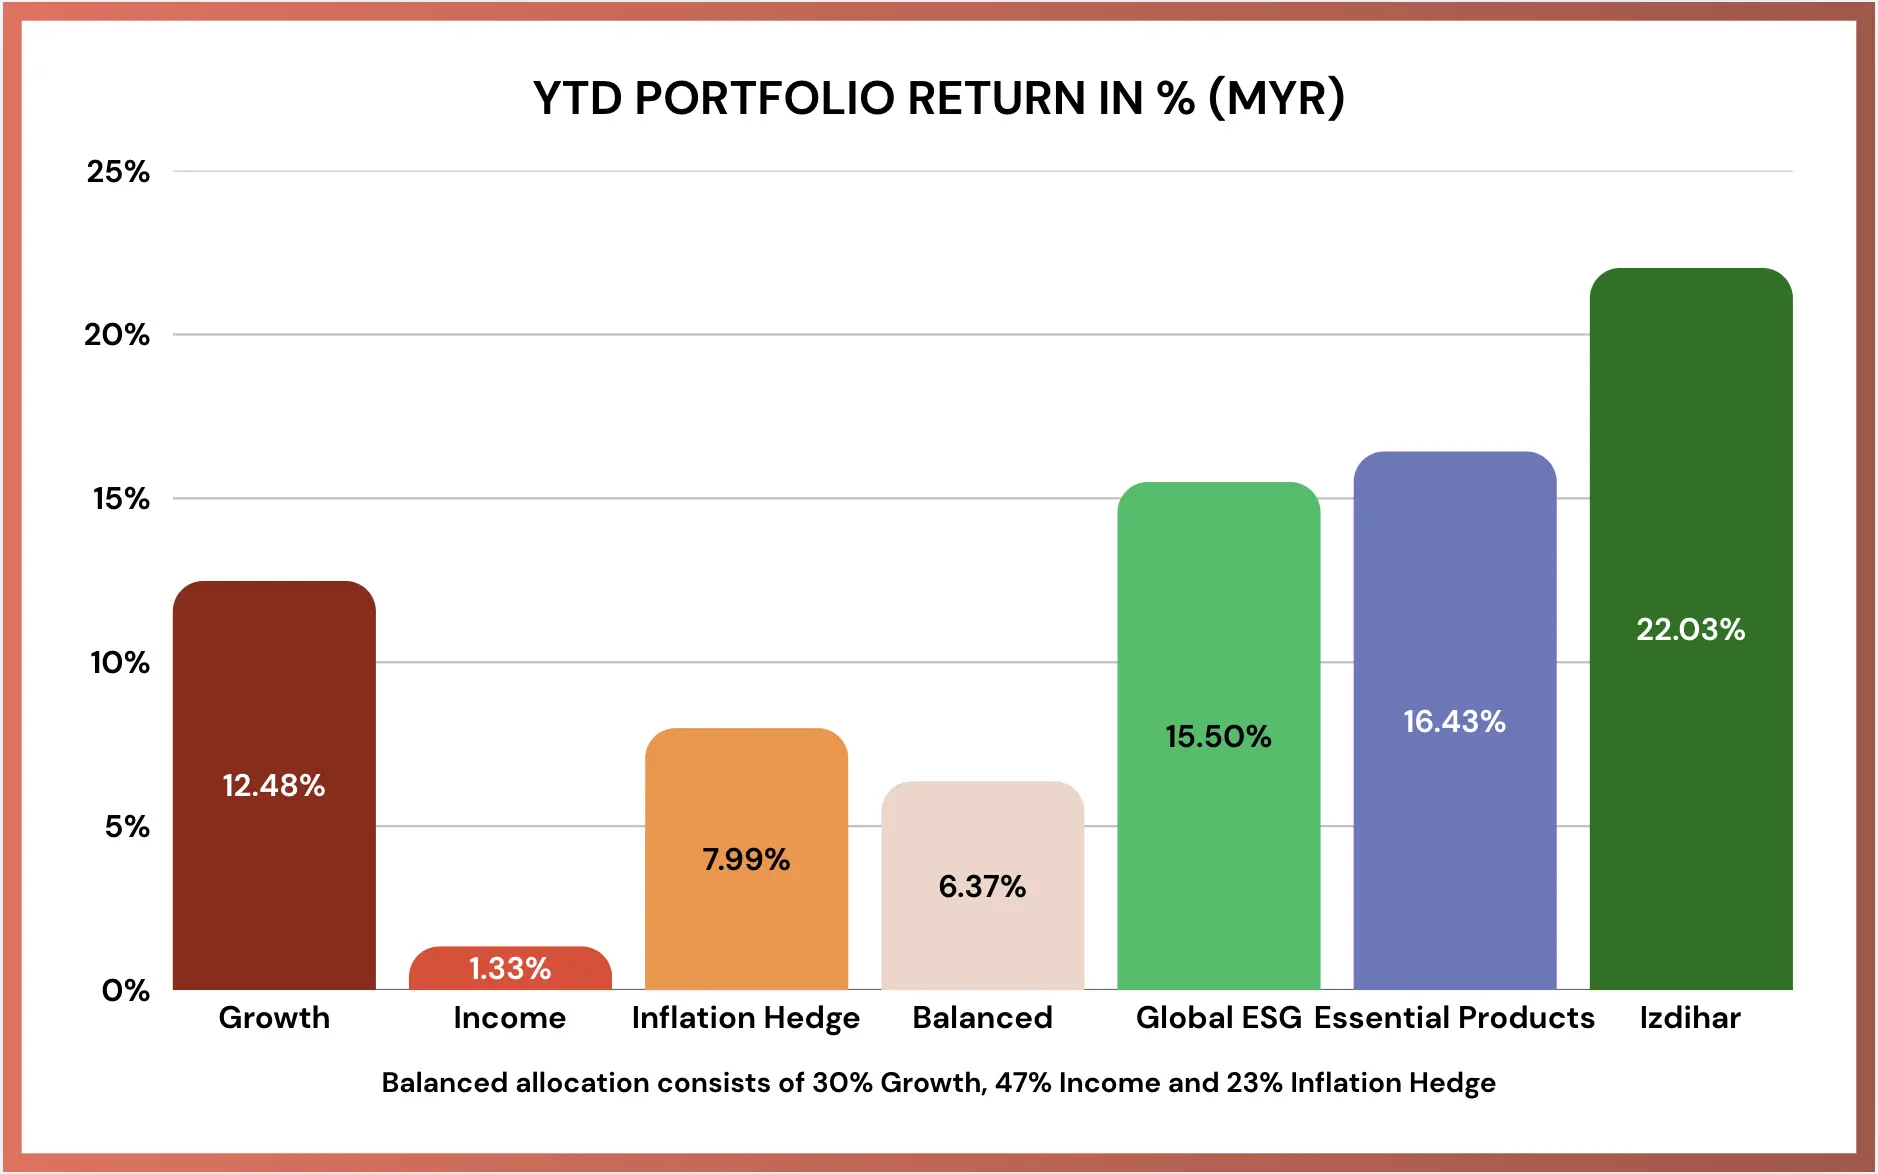
*YTD = Year to Date
*Source: GAX MD Sdn Bhd, data in USD term for the month of June 2026
Past performance is not an indication of future performance.
HOW TO CALCULATE YOUR OMAKASE RETURNS
Your Omakase return is the weighted sum of each portfolio's monthly return. Using the balanced allocation as an example:
Using the Balanced allocation as an example, with 30% Growth, 47% Income and 23% Inflation Hedge, a Balanced Omakase returned approximately 6.37% YTD in MYR as of 30 June 2026. Your actual return varies with your personal allocation and investment timing.
Your actual return varies based on your personal allocation and investment timing.
Performance Commentary
June marked a clear rotation in underlying market trend. After months of strong gains, major technology stocks entered a consolidation phase as investors took profits. At the same time, other segments of the market continued to trend higher. A stronger US dollar added another tailwind, lifting returns when translated into Malaysian Ringgit (MYR). Against this backdrop, most MYTHEO portfolios ended the month in positive territory.
The ESG Portfolio was the standout performer in June, advancing 3.29% in MYR terms. Performance was led by large‑cap ESG growth stocks (NULG), which gained 4.09% in USD terms. Despite notable pullbacks in Nvidia (‑11.94%) and Broadcom (‑19.70%), the broader ETF remained resilient. Six of its top ten holdings posted double‑digit gains, including Applied Materials (+42.07%), Lam Research (+23.38%), and GE Vernova (+19.34%).
The Growth Portfolio also generated a positive return of 2.65% in MYR terms. While growth stocks (VUG) declined 3.75% amid a technology‑led sell‑off, the portfolio benefited from its allocation to value-oriented equities. Value stocks (VTV) and mid-cap value (VOE) gained 3.38% and 2.04%, respectively, helping to support overall portfolio performance.
The Shariah‑compliant Izdihar Portfolio gained 2.05% in MYR terms. US Shariah equities paused in June, with HLAL and SPUS declining 2.37% and 1.73%, respectively. However, international Shariah exposures helped offset this softness. UMMA and SPWO advanced 3.01% and 1.64%, contributing positively to overall returns and demonstrating the strategic value of global diversification within Shariah mandates.
1. Commodity Drop Drags Inflation Hedge While Essential Products Stabilizes
Real assets faced significant liquidation pressure in June, particularly across precious metals and commodities. Silver plunged 21.75%, while oil (DBO) and gold (IAU) fell 16.51% and 11.67%, respectively. Despite these sharp declines, the Inflation Hedge Portfolio proved relatively resilient, ending the month down only 2.72% in MYR terms.
Defensive real estate and infrastructure helped soften the impact of the commodity sell‑off. Mortgage REITs (REM) gained 2.0%, US REITs (IYR) added 1.30%, and global infrastructure (IGF) rose 1.41%. These steady, income‑oriented assets provided a useful buffer during a month when metals and energy were under pressure.
A similar dynamic played out within the Essential Portfolio, which finished the month nearly flat at -0.08% in MYR terms. While clean energy (ICLN) and lithium (LIT) came under pressure, declining 12.83% and 9.79%, respectively. However, water infrastructure holdings delivered strong gains of 5% to 6%, offering significant support and helping the portfolio hold steady despite weakness in other thematic exposures.
2. Income Portfolio Benefits from Stronger US Dollar
The Income Portfolio posted a solid 2.44% return in MYR terms. In USD terms, performance was essentially flat at ‑0.04%, with the stronger US dollar providing a notable uplift when translated into Ringgit.
Excluding currency effects, long‑duration US Treasuries (TLT) were the primary contributor, rising 1.17%. Emerging market bonds (EMLC) also added 0.31%. In contrast, international government bonds declined more than 2% following the European Central Bank’s interest rate hike in June.
3. Conclusion
June showed how quickly markets can change direction. Technology slowed, commodities corrected sharply, and yet other parts of the market continued to move higher. This kind of rotation is exactly why MYTHEO does not depend on a single theme or a single source of return.
Behind the scenes, MYTHEO’s portfolios are guided by algorithms that monitor many different risk factors at the same time. When one part of the market weakens, the system naturally leans on other areas with stronger risk‑adjusted potential. It is not about predicting the next winner. It is about making sure investors get the best possible return for every unit of risk taken.
As market trend continues to shift, MYTHEO’s rules‑based approach keeps investors positioned in the right mix of opportunities. It does this automatically, consistently and without emotional decision‑making. Over time, this multi‑engine, strategic‑risk‑factor design helps investors compound more smoothly through different market cycles.
Appendix
ETF Performance Summary by Portfolio | June 2026
1. Growth Portfolio
RISK: HIGH | Diversified global equities
2. Income Portfolio
RISK: LOW | Global fixed income & bonds
3. Inflation Hedge Portfolio
RISK: MEDIUM | Real assets & commodities
4. ESG Portfolio
RISK: HIGH | Global equities — sustainable & responsible investing
5. Essential Products Portfolio
RISK: HIGH | Commodities, energy & agriculture
6. Izdihar Portfolio
RISK: HIGH | Shariah-compliant global equities
*Returns are in USD terms for the month of June 2026.
Top and Bottom performers ranked by 1-month return within each portfolio. Past performance is not indicative of future results.
Ready to explore how MYTHEO works for your goals? Learn more here.
Or download our app so you can start investing in a moment. Download on iOS here or Android here.
*This material is subject to MYTHEO's Notice and Disclaimer. All performance figures are net of management fees.
Past performance is not indicative of future results.
This material is subject to MYTHEO’s Notice and Disclaimer.