Key Takeaways
- April’s rally did more than recover the losses from March. The rebound was strong enough to not only erase the earlier drawdown, but also portfolio values above pre-conflict levels.
- Technology and growth exposures played a key role in the recovery. Portfolios with meaningful allocation to these sectors led performance, supported by solid earnings and a return of investor confidence.
- Investors who stayed invested through the volatility in March are now in a stronger position. The past two months highlight the cost of reacting to short-term market stress and the benefit of maintaining discipline.
MYTHEO omakase PORTFOLIOS
Omakase combines Growth, Income & Inflation Hedge in an optimised weightage proportion that is personalised accordingly to your risk profile. Your return is the weighted sum of these three functional portfolios.
1. Growth Portfolio
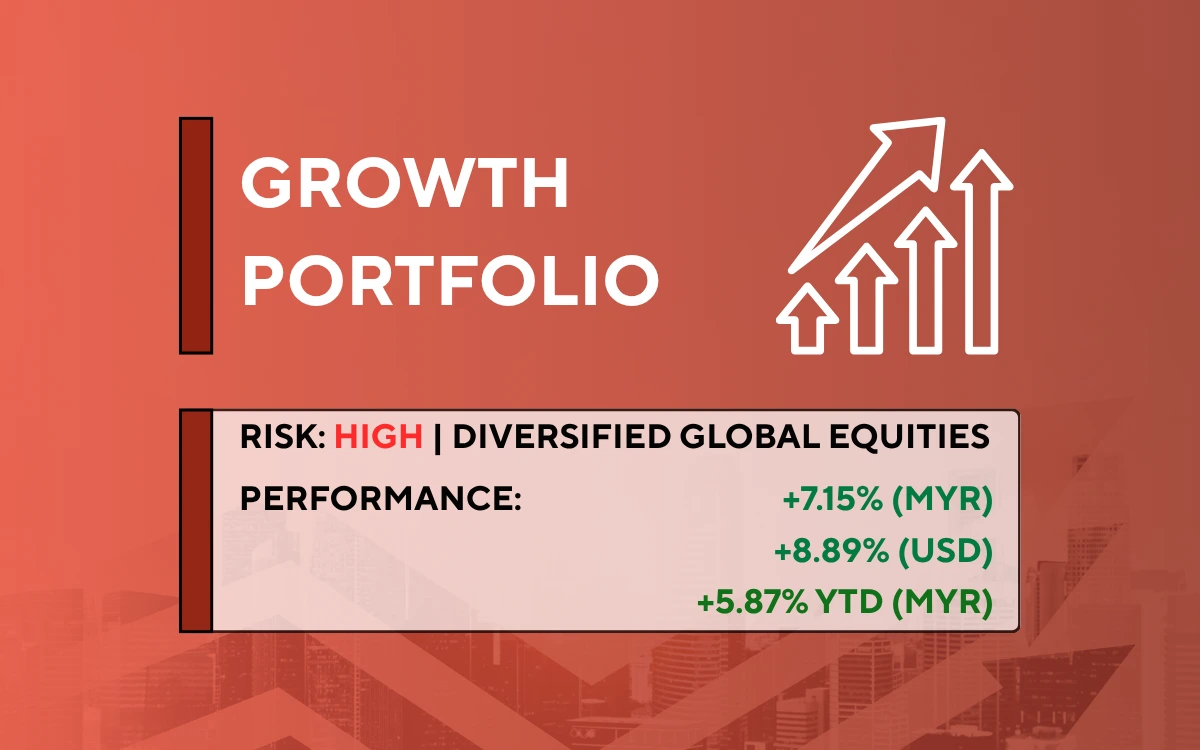
*YTD = Year to Date
*Source: GAX MD Sdn Bhd, data in USD term for the month of April 2026
Past performance is not an indication of future performance.
2. Income Portfolio
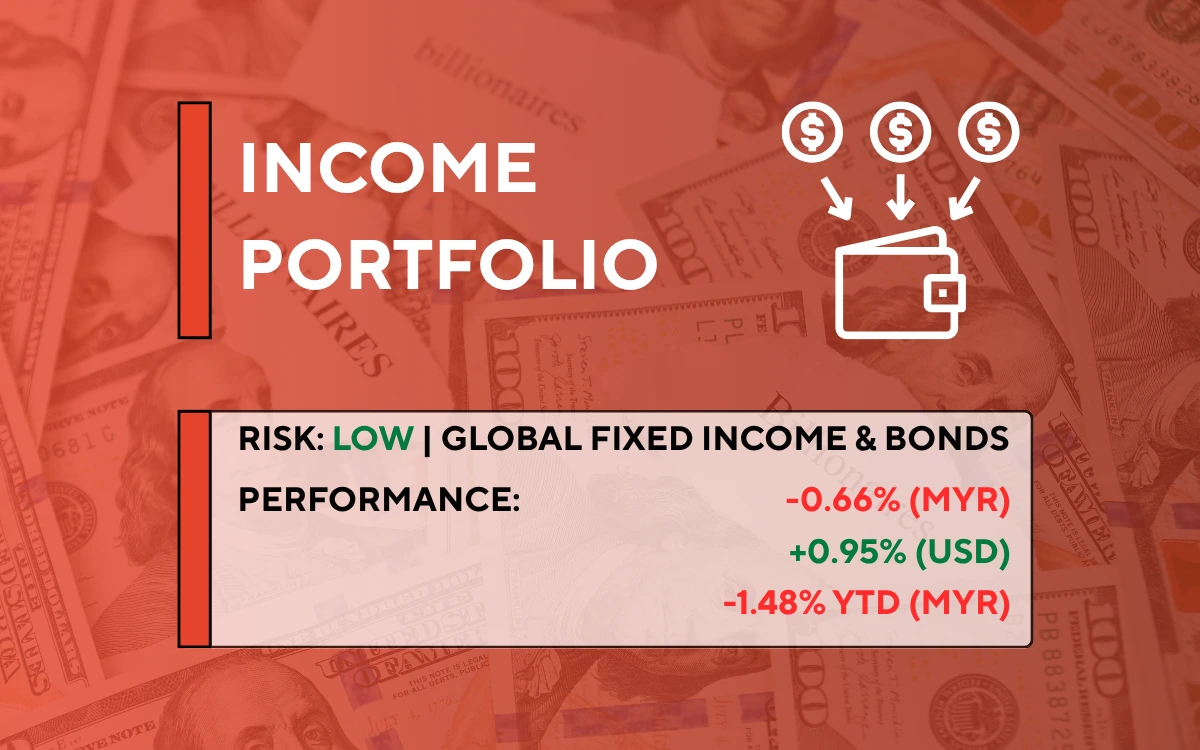
*YTD = Year to Date
*Source: GAX MD Sdn Bhd, data in USD term for the month of April 2026
Past performance is not an indication of future performance.
3. Inflation hedge Portfolio
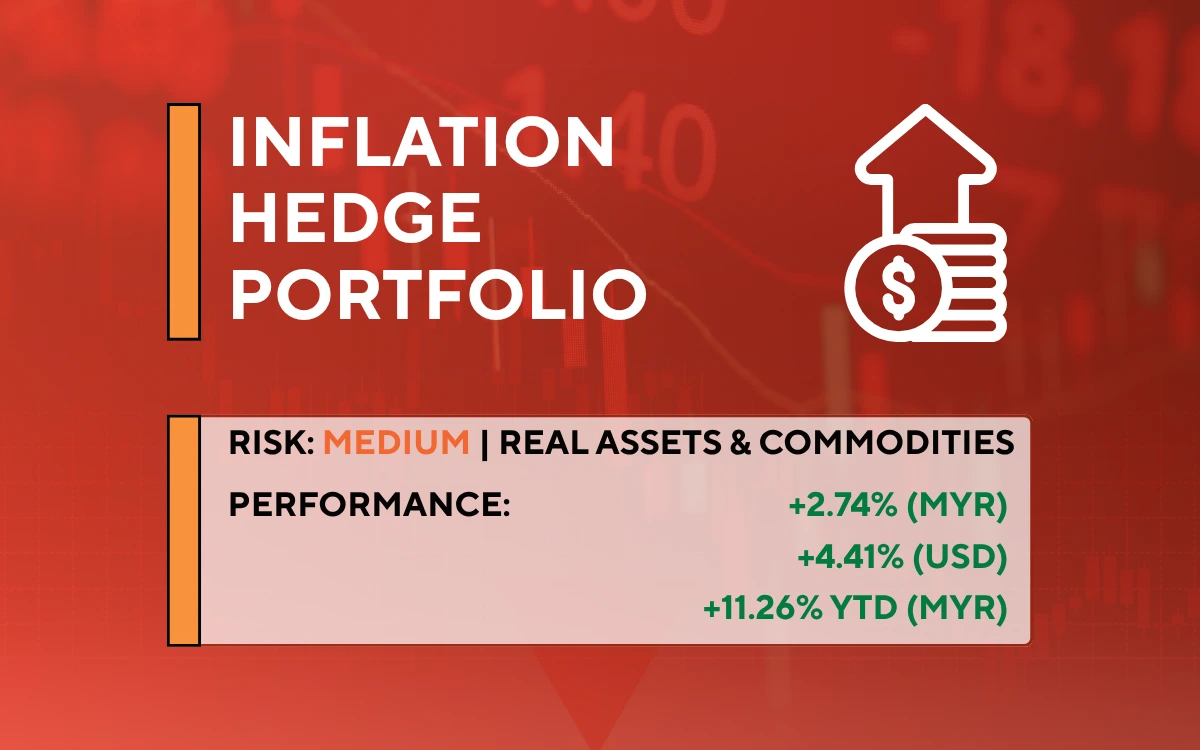
*YTD = Year to Date
*Source: GAX MD Sdn Bhd, data in USD term for the month of April 2026
Past performance is not an indication of future performance.
MYTHEO satellite PORTFOLIOS
Global ESG, Essential Products, and Izdihar are standalone portfolios — each with its own investment theme. They can be held independently or alongside an Omakase allocation.
4. Global ESG Portfolio
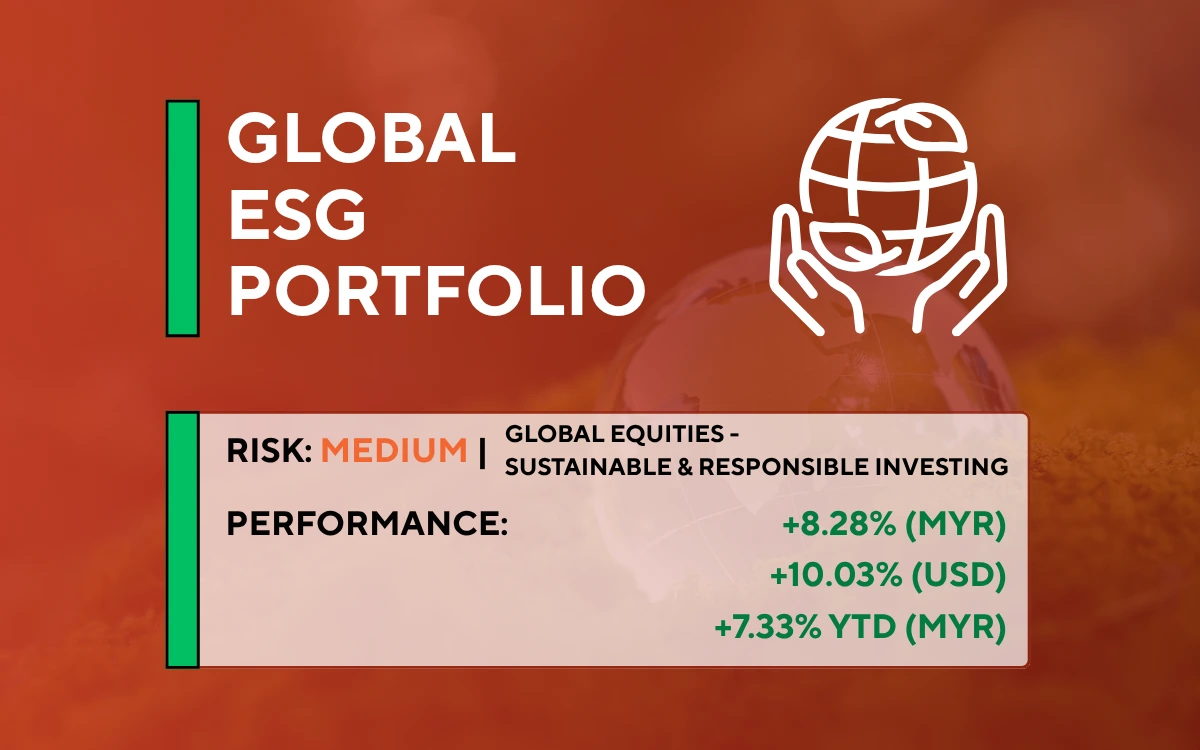
*YTD = Year to Date
*Source: GAX MD Sdn Bhd, data in USD term for the month of April 2026
Past performance is not an indication of future performance.
5. Essential Products Portfolio
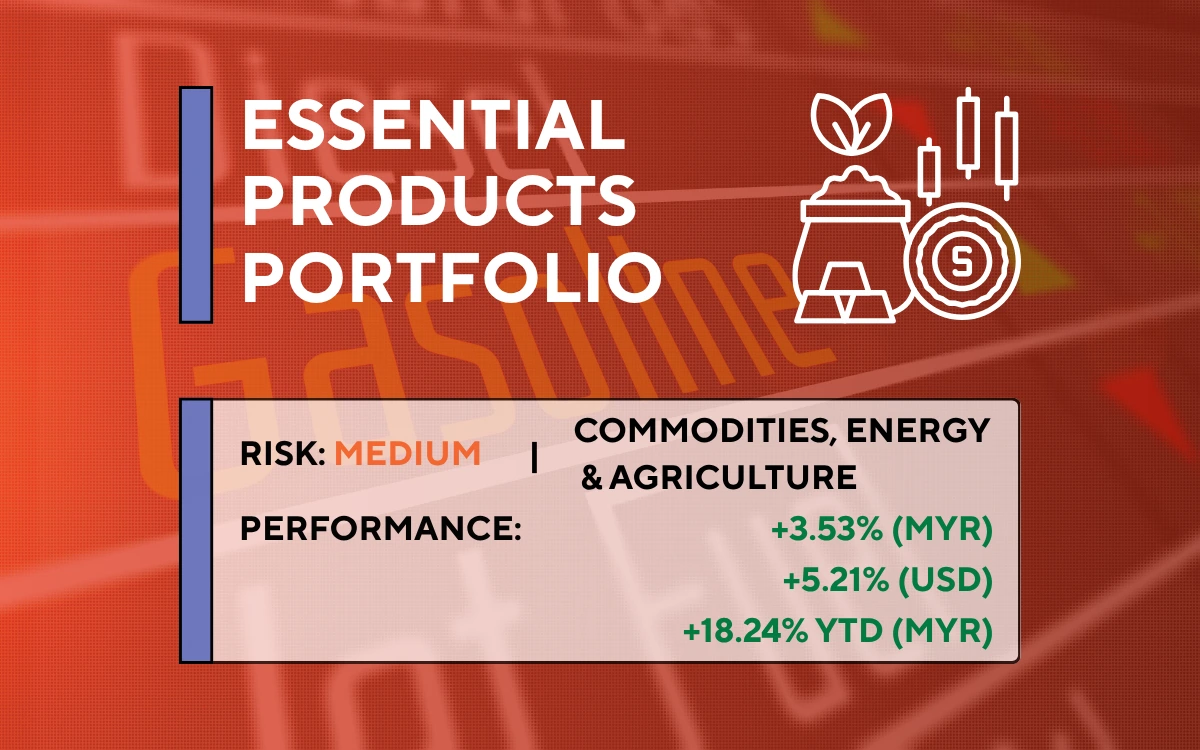
*YTD = Year to Date
*Source: GAX MD Sdn Bhd, data in USD term for the month of April 2026
Past performance is not an indication of future performance.
6. Izdihar Portfolio
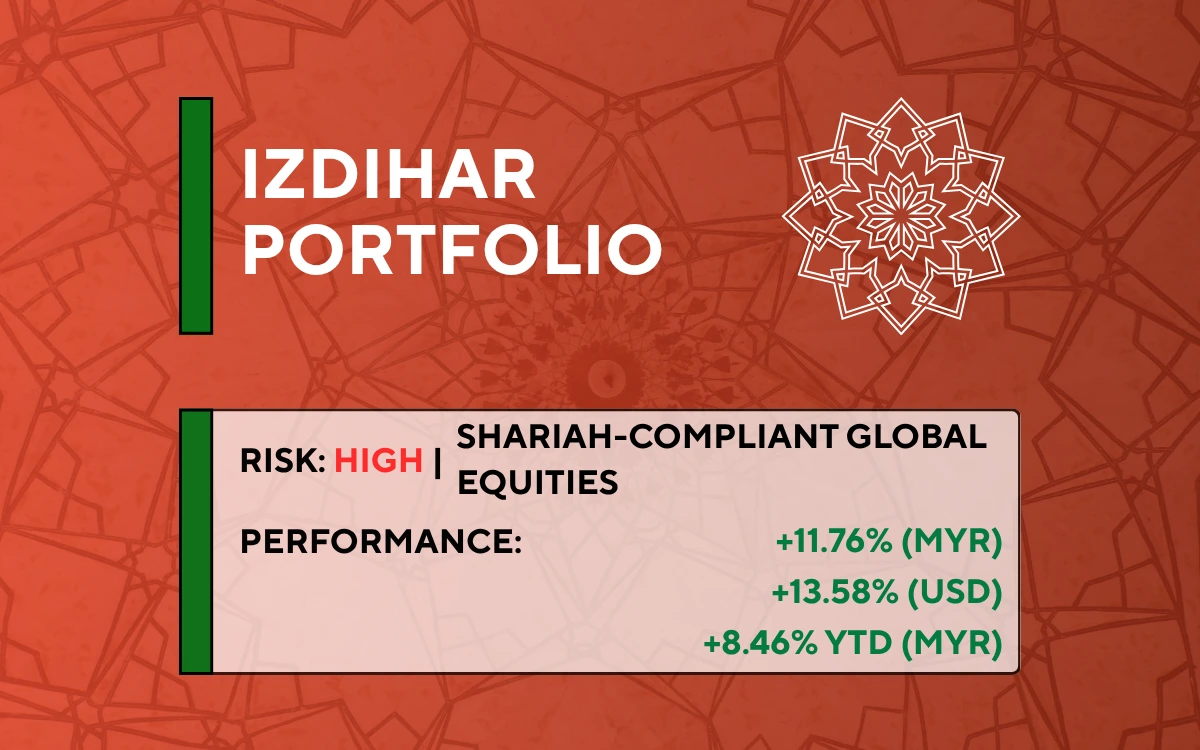
*YTD = Year to Date
YTD PORTFOLIO RETURN IN % (MYR)
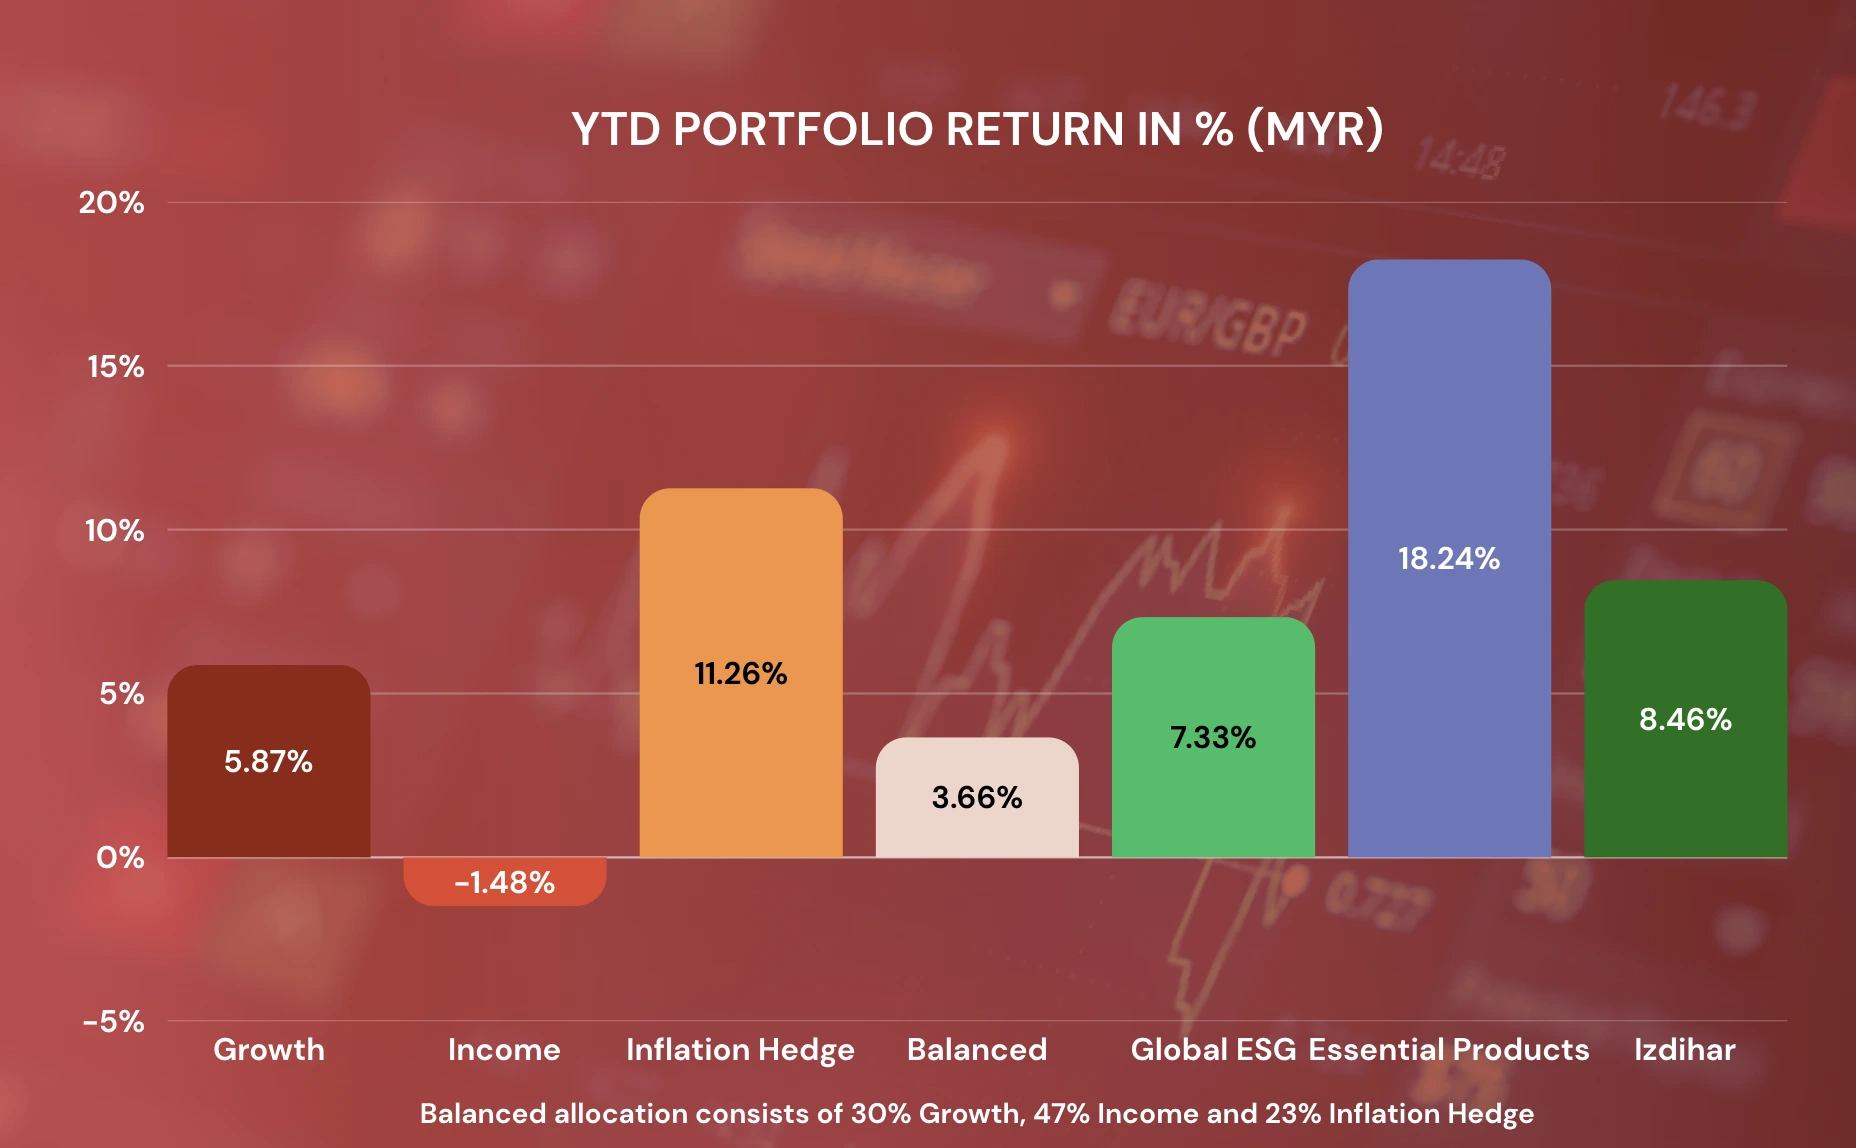
*YTD = Year to Date
Source: GAX MD Sdn Bhd, April 2026 | Past performance is not an indication of future performance.
HOW TO CALCULATE YOUR OMAKASE RETURNS
Your Omakase return is the weighted sum of each portfolio's monthly return. Using the balanced allocation as an example:
For instance, assuming allocations of 30% to the Growth portfolio, 47% to the Income portfolio and 23% to the Inflation Hedge Portfolio, the YTD portfolio return in MYR as of February would be 1.74%. [(30% x 1.38%) + (47% x -2.05%) + (23% x 10.17%)]
Your actual return varies based on your personal allocation and investment timing.
CIO Commentary
April 2026 Market Review
After the sharp sell-off in March, markets bounced back strongly in April. The recovery was not just quick, but also more than enough to offset the earlier losses. Most MYTHEO portfolios have now fully recovered what was given up in March.
Technology and AI Led the Recovery
The rebound was largely driven by technology and AI-related names, following a series of solid earnings releases from big technology companies. The strong results gave investors enough confidence to return to the market despite the worries of ongoing war in Iran.
Equity portfolios delivered strong gains, led by strategies with higher technology exposure. MYTHEO Izdihar, with over 50% allocated to the sector, advanced 13.58%, supported by a 20.96% rise in the Global Technology ETF (SPTE).
The MYTHEO Growth portfolio increased 8.89% in USD, lifted by the strong rebound in growth stocks, with VUG up 14.25%. Similarly, the MYTHEO ESG portfolio gained 10.03% in USD, aided by its allocation to large‑cap grwth via NULG, which climbed 14.89%.
Energy Exposure Benefited from Ongoing Geopolitical Tensions
Despite the ceasefire, geopolitical tensions involving Iran continued to shape market sentiment. The prolonged closure of the Strait of Hormuz kept crude oil prices elevated, with Brent ending April above US$100 per barrel.
This supported energy‑related exposures across MYTHEO portfolios. Both the Inflation Hedge and Essential portfolios benefited from gains in crude oil (DBO), alongside strength in clean energy (ICLN) and alternative energy assets such as lithium (LIT).
Income Portfolio Held Up Despite Pressure from Yields
The MYTHEO Income portfolio posted a gain of 0.95% in USD. This came despite weakness in US Treasuries (TLT, IEI) and US investment-grade corporate bonds (LQD), as bond yields moved higher during the month.
Gains from emerging market bonds (EMLC) and international fixed income (IGOV) helped offset some of that pressure. That said, when translated into MYR, the portfolio was down by 0.66% as the US dollar weakened against the ringgit during the month.
Conclusion
April was a clear turnaround from the market conditions seen in March. The fear-driven selling faded quickly, and investors rotated back into risk assets with conviction. The rebound not only recovered prior losses, but also pushed portfolio values above pre‑conflict levels.
MYTHEO Portfolios: Monthly Performance Snapshot for March and April 2026
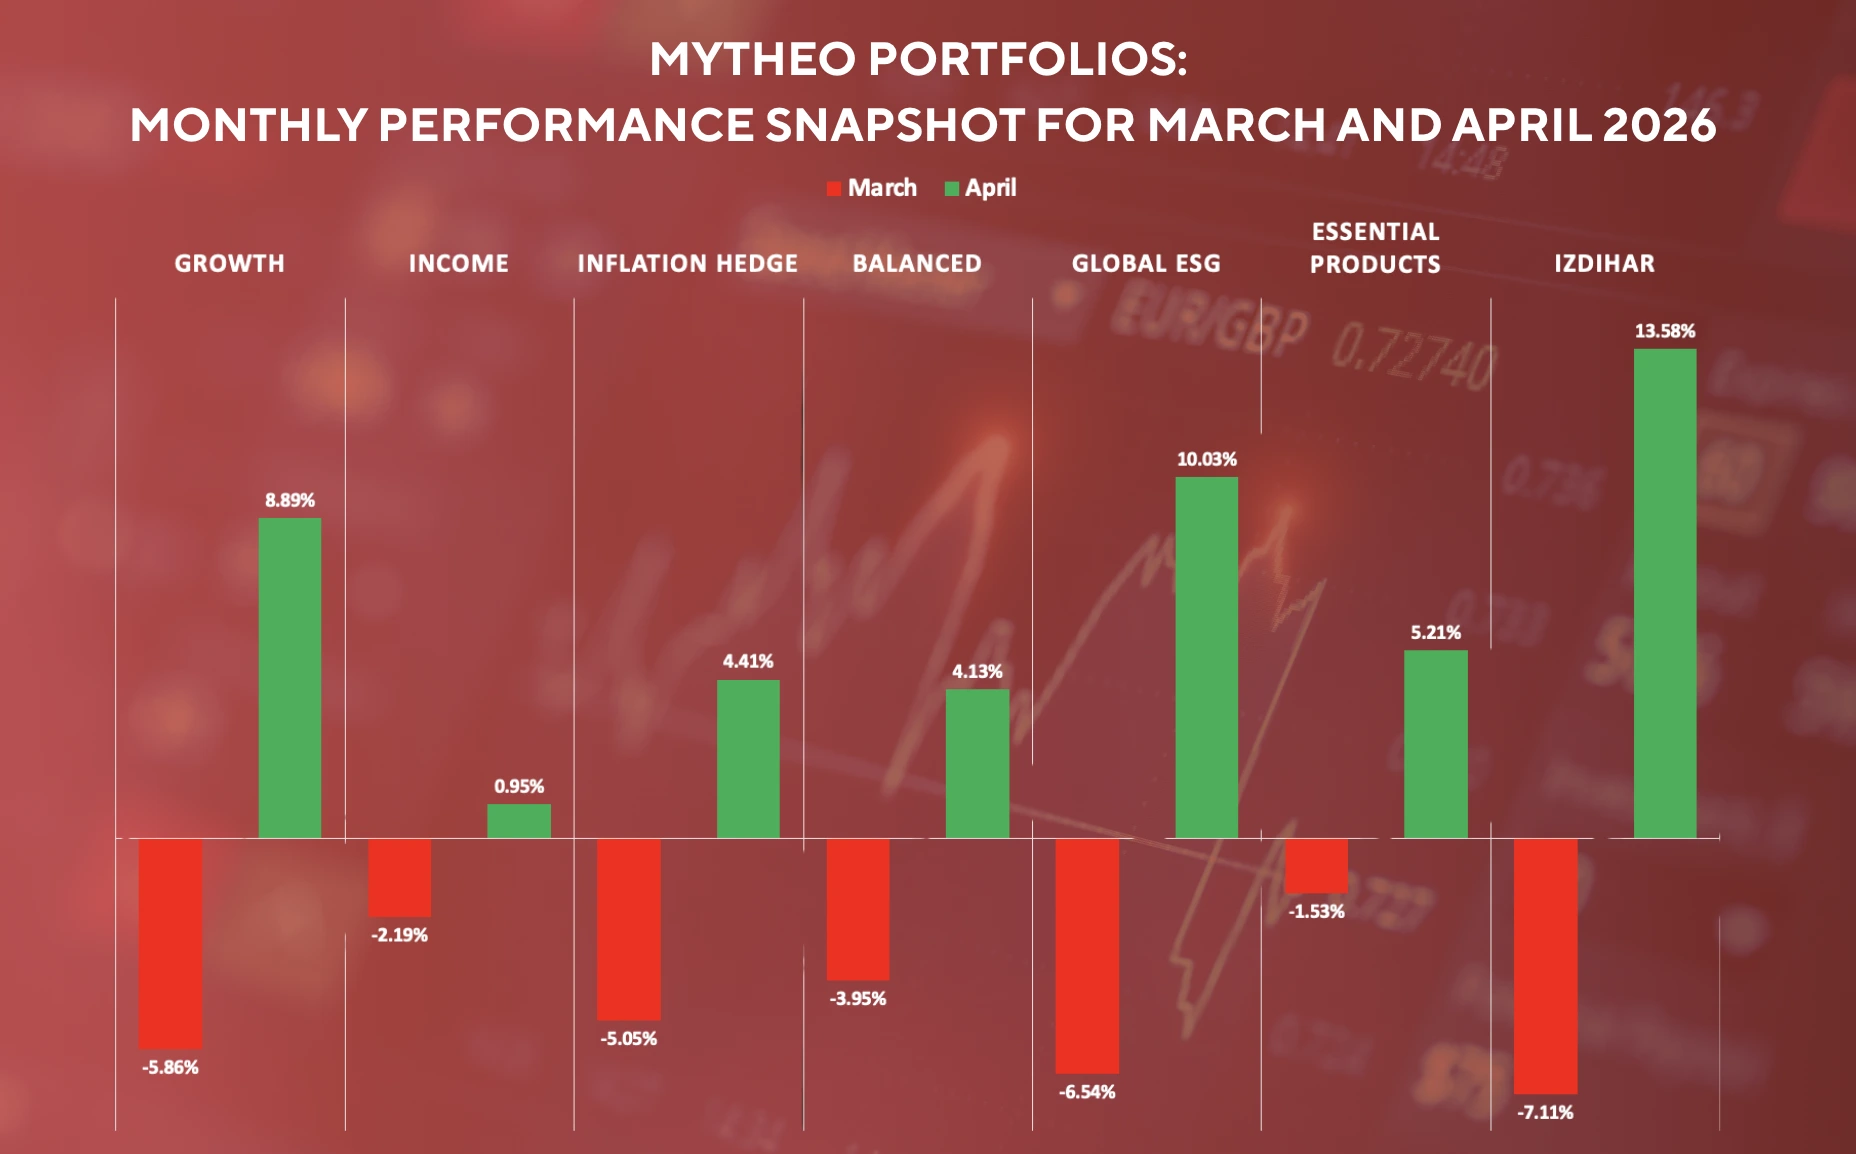
All MYTHEO portfolios delivered positive returns in USD. Apart from the Income and Inflation Hedge portfolios, most portfolios recorded gains in April that were larger than the losses seen in March. Investors who stayed invested are now in a stronger position than they were before the drawdown. The past two months serve as a useful reminder. Short-term market moves can be sharp and uncomfortable but stepping out during periods of uncertainty often comes at a higher cost than staying the course.
Ready to explore how MYTHEO works for your goals? Learn more here.
Or download our app so you can start investing in a moment. Download on iOS here or Android here.
*Past performance is not indicative of future results. All investments involve risk, including possible loss of principal.
This material is subject to MYTHEO’s Notice and Disclaimer.