9 December 2025
Written by MYTHEO
Key Takeaways
- The highly publicised global sell-off was selective, targeting technology stocks with stretched valuations. The true market pattern was a rotation of capital directly into value stocks, including mid-cap and high-profile tech stocks.
- Expectations for US interest rate cuts and rising market uncertainty drove a spectacular performance in precious metals, which supports the performance of Inflation Hedge and Essential Products portfolios.
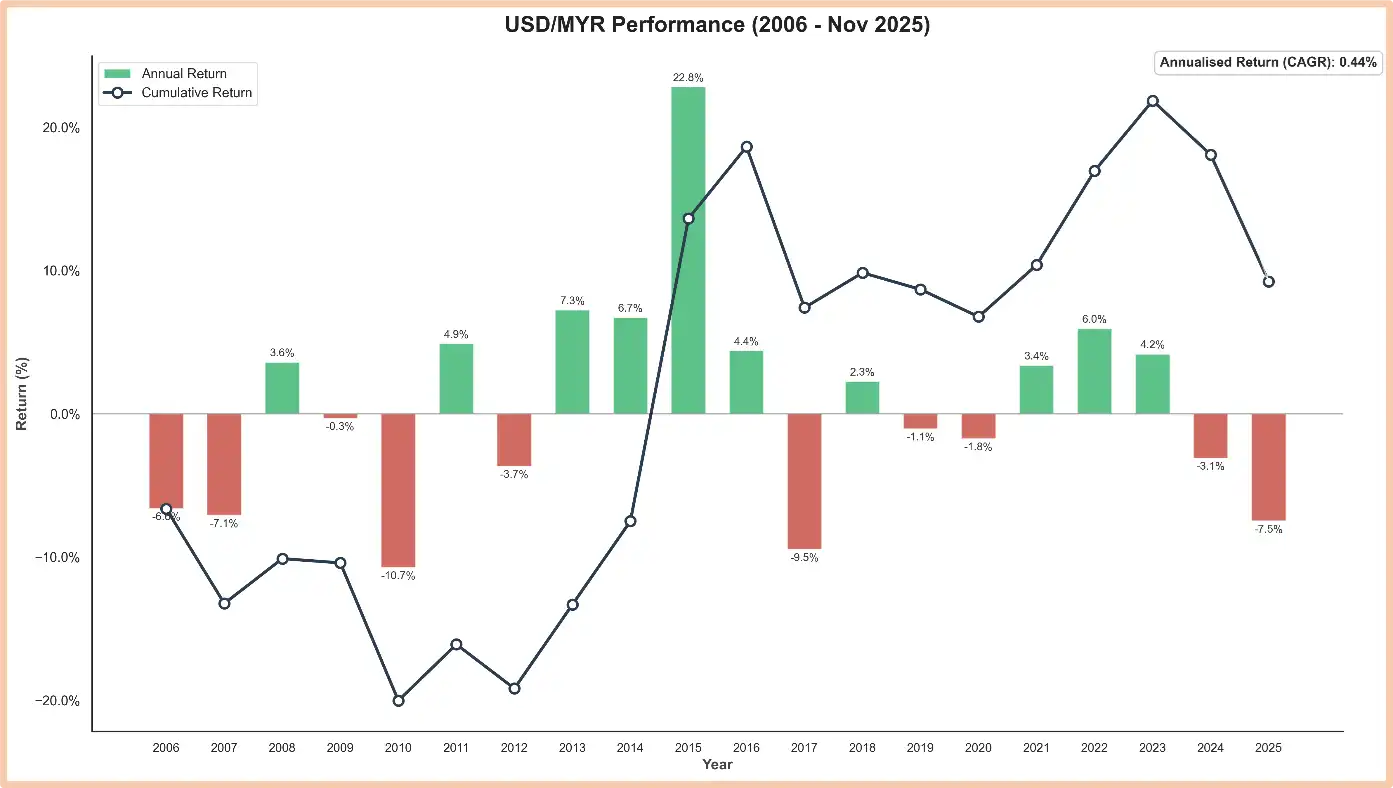
- Malaysian Ringgit was the biggest headwind to the MYTHEO portfolios' performance in MYR terms. The impact of currency fluctuations tends to be far less meaningful over the long term.
1. Growth Portfolio
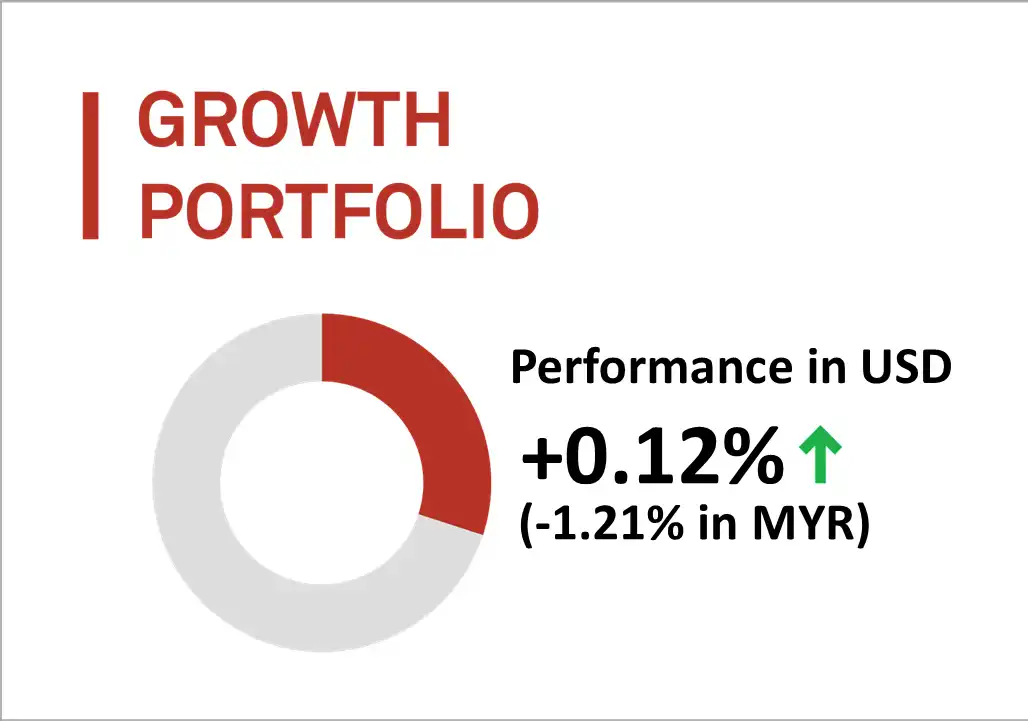
MYTHEO’s Growth Portfolio was up by 0.12% but down 1.21% in MYR) in November 2025.
The Growth Portfolio extended its positive run to seven consecutive months in USD terms. However, the strong appreciation of the Ringgit resulted in a negative return when measured in MYR.
The portfolio benefited notably from its exposure to Canada (EWC), which was the strongest contributor for the month. Canada’s market was supported by expectations of an economic rebound, with third-quarter GDP anticipated to recover to positive 0.50% after a 1.60% contraction in the second quarter.
The Canadian market also gained from strong performance in gold-related equities. Major Canadian gold producers such as Barrick Gold, Agnico Eagle Mines, and Franco Nevada Corporation posted meaningful gains in response to higher global gold prices.
Although there were growing concerns about valuation risk in the AI sector, investors did not fully withdraw from equities. Instead, capital rotated into alternative themes. This shift supported mid-cap and value exposures, resulting in solid gains for these strategies. Mid-cap value stocks (VOE) and value stocks (VTV) rose by 3.11% and 2.63%, respectively.
Top 3 ETFs performance (Growth portfolio)
ISHARES MSCI CANADA (EWC)
VANGUARD MID-CAP VALUE INDEX FUND (VOE)
VANGUARD VALUE (VTV)
+4.01%
+3.11%
+2.63%
Bottom 3 ETFs performance (Growth portfolio)
VANGUARD FTSE EMERGING MARKETS (VWO)
VANGUARD GROWTH INDEX FUND ETF (VUG)
VANGUARD FTSE PACIFIC (VPL)
-1.61%
-1.11%
-0.56%
Source: GAX MD Sdn Bhd, data in USD term for the month of November 2025.
2. Income Portfolio
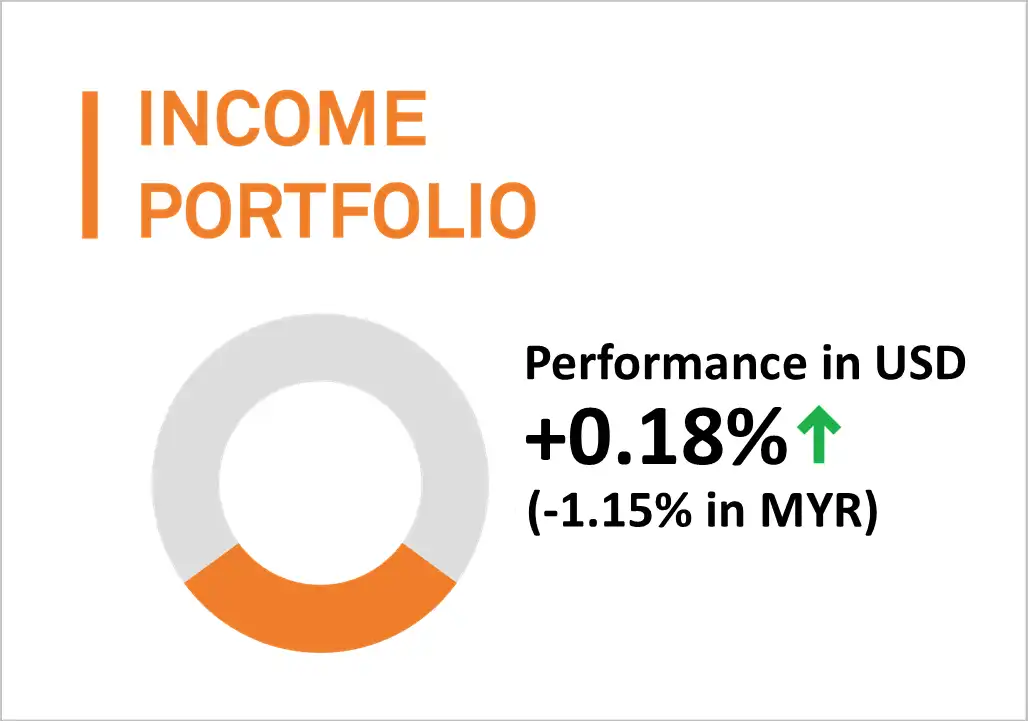
In November 2025, the MYTHEO Income Portfolio increased by 0.18% in USD terms but declined by 1.15% when converted to MYR due to Ringgit strength.
In USD terms, performance was mixed, with no single factor dominating the month’s outcome. Although the 10-year US Treasury yield declined further to 4.019%, the impact on the portfolio was limited.
A key positive driver was the weakness of the US Dollar relative to emerging market currencies. This supported Emerging Market Local Currency Bonds, which rose 1.49%, making them the strongest performer in the Income Portfolio.
Senior Loans (SRLN) and short-term high yield bonds (SJNK) also performed well, posting gains of 0.69% and 0.56%, respectively. Both assets benefited from yield-seeking investor flows in an environment of declining rate expectations. At current levels, SRLN offers a yield of approximately 7.8%, while SJNK provides about 6.45%.
Top 3 ETFs performance (Income portfolio)
MARKET VECTORS EMERGING MARKETS (EMLC)
SPDR BLACKSTONE/GSO SENIOR LOAN (SRLN)
SPDR BARCLAYS SHORT-TERM HIGH YIELD (SJNK)
+1.49%
+0.69%
+0.56%
Bottom 3 ETFs performance (Income portfolio)
ISHARES US PREFERRED STOCK (PFF)
ISHARES INTERNATIONAL TREASURY (IGOV)
ISHARES 20+ YEAR TREASURY BONDS (TLT)
-0.61%
-0.52%
-0.03%
Source: GAX MD Sdn Bhd, data in USD term for the month of November 2025.
3. Inflation Hedge Portfolio
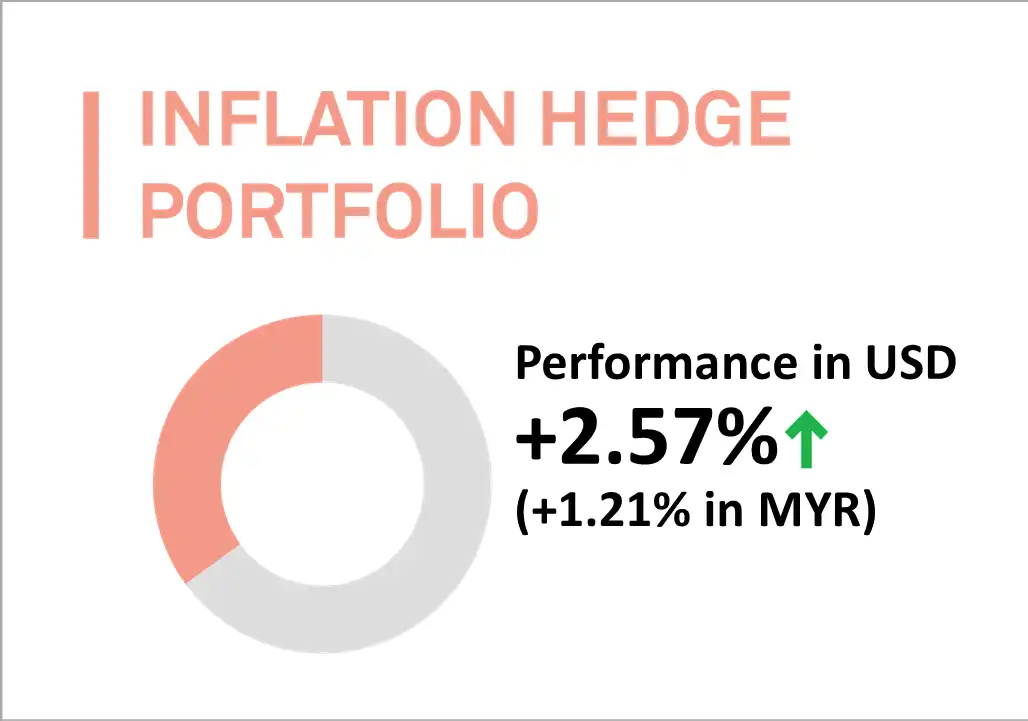
The MYTHEO Inflation Hedge Portfolio delivered a strong return of 2.57% in USD terms, which translated to a gain of 1.21% in MYR.
Precious metals were the main drivers of performance. Demand for these assets increased due to several factors, including the broad sell-off in cryptocurrency and technology markets, along with rising expectations that the US Federal Reserve may cut interest rates later in the month.
Gold prices rose 6.02%, while Silver was the standout performer in November, gaining 17.61%. This was Silver’s largest monthly increase since its 30.46% surge in July 2020. Within MYTHEO’s portfolio allocation, the gold (IAU) and silver (SLV) exposures delivered gains of 4.78% and 15.49%, respectively.
Top 3 ETFs performance (Inflation hedge portfolio)
ISHARES SILVER TRUST (SLV)
ISHARES MORTGAGE REAL ESTATE (REM)
ISHARES GOLD TRUST (IAU)
+15.49%
+5.00%
+4.78%
Bottom 3 ETFs performance (Inflation hedge portfolio)
INVESCO DB OIL FUND (DBO)
ISHARES S&P GLOBAL CLEAN ENERGY INDEX ETF (ICLN)
ISHARES TIPS BOND ETF (TIP)
-0.84%
-0.23%
+0.38%
Source: GAX MD Sdn Bhd, data in USD term for the month of November 2025.
4. Global ESG Portfolio
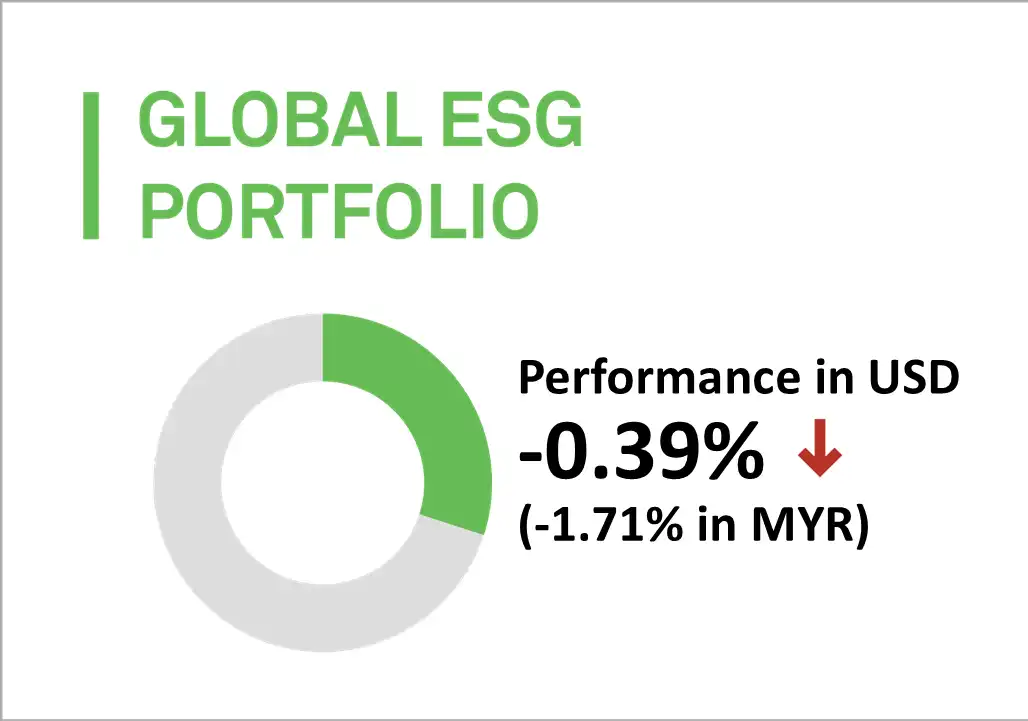
MYTHEO’s Global ESG dropped by 0.39% (decreased by 1.71% in MYR).
The global sell-down in technology stocks had a clear impact on the portfolio. Large Cap Growth stocks (NULG), with roughly 51% exposure to the information technology sector, declined by 3.62% for the month.
Emerging Market ESG (ESGE) also registered a decline of 1.61%, driven by broad weakness across its key constituents. Core holdings such as Taiwan Semiconductor (TSMC), Tencent, Samsung Electronics, Alibaba, and SK Hynix fell between 2.78% and 8.24%, contributing to the ETF’s overall negative return.
In contrast, value-oriented stocks, which tend to trade at more attractive valuations relative to historical norms, performed well and provided stabilizing support to the portfolio. Large Cap Value (NULV) gained a solid 2.74% in November.
NULV’s performance was strongly supported by its top holding, Alphabet, which was the standout performer among major technology names, with a gain of 13.87%. The remainder of NULV’s holdings are well diversified across resilient, defensive sectors, including Procter and Gamble, Coca-Cola, AbbVie, Morgan Stanley, and Citigroup.
Top 3 ETFs performance (Global ESG portfolio)
NUVEEN ESG LARGE-CAP VALUE ETF (NULV)
ISHARES MSCI USA ESG SELECT ETF (SUSA)
ISHARES ESG AWARE MSCI USA ETF (ESGU)
+2.74%
+0.47%
+0.35%
Bottom 3 ETFs performance (Global ESG portfolio)
NUVEEN ESG LARGE-CAP GROWTH ETF (NULG)
ISHARES ESG AWARE MSCI EM ETF (ESGE)
ISHARES ESG AWARE MSCI EAFE ETF (ESGD)
-3.62%
-1.61%
+0.22%
Source: GAX MD Sdn Bhd, data in USD term for the month of November 2025.
5. Essential Products Portfolio
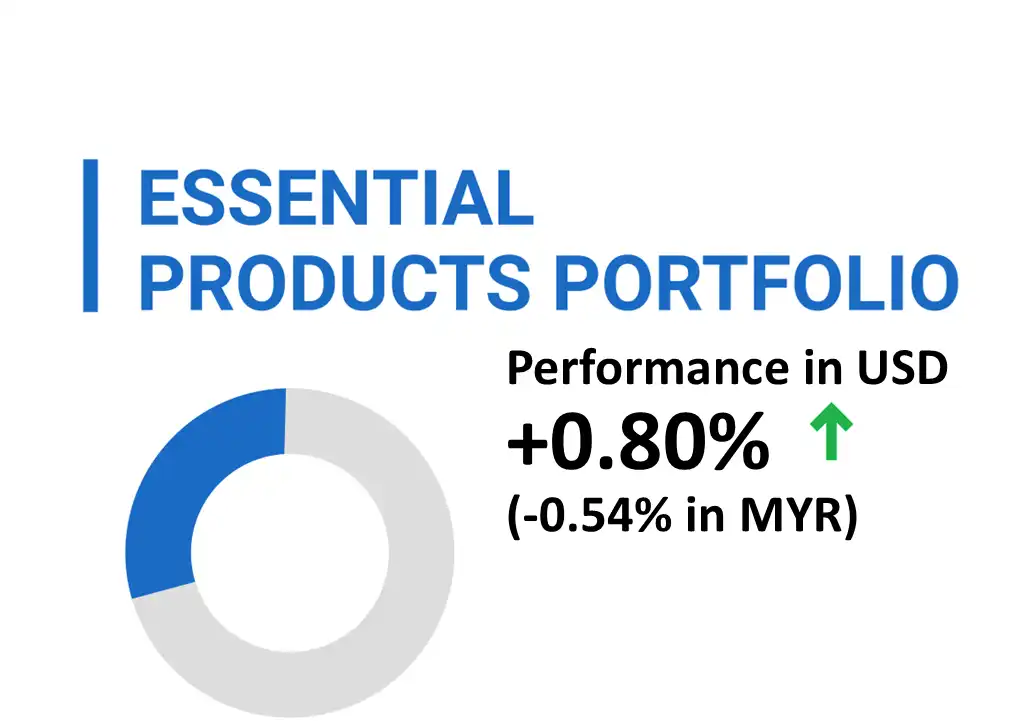
The MYTHEO Essential Products portfolio recorded a gain of 0.80% in USD, decreased by 0.54% in MYR terms.
The Essential Products Portfolio gained in USD terms, led by the energy sector (XLE). This strength came despite a 3.98% decline in WTI crude oil prices.
Agribusiness (MOO) and agriculture equities (VEGI) also contributed positively, supported by reports that China increased purchases of US agricultural products, including at least ten cargoes of soybeans.
Only two ETFs posted negative returns: Wind Energy (FAN) and Clean Energy (ICLN), both of which experienced profit-taking following strong gains in the previous month.
Top 3 ETFs performance (Essential products portfolio)
ENERGY SELECT SECTOR SPDR (XLE)
VANECK AGRIBUSINESS ETF (MOO)
ISHARES MSCI AGRICULTURE PRO (VEGI)
+3.38%
+1.98%
+1.06%
Bottom 3 ETFs performance (Essential products portfolio)
FIRST TRUST GLOBAL WIND ENER (FAN)
ISHARES S&P GLOBAL CLEAN ENERGY INDEX ETF (ICLN)
GLOBAL X LITHIUM & BATTERY T (LIT)
-1.88%
-0.23%
+0.49%
Source: GAX MD Sdn Bhd, data in USD term for the month of November 2025.
6. Izdihar Portfolio
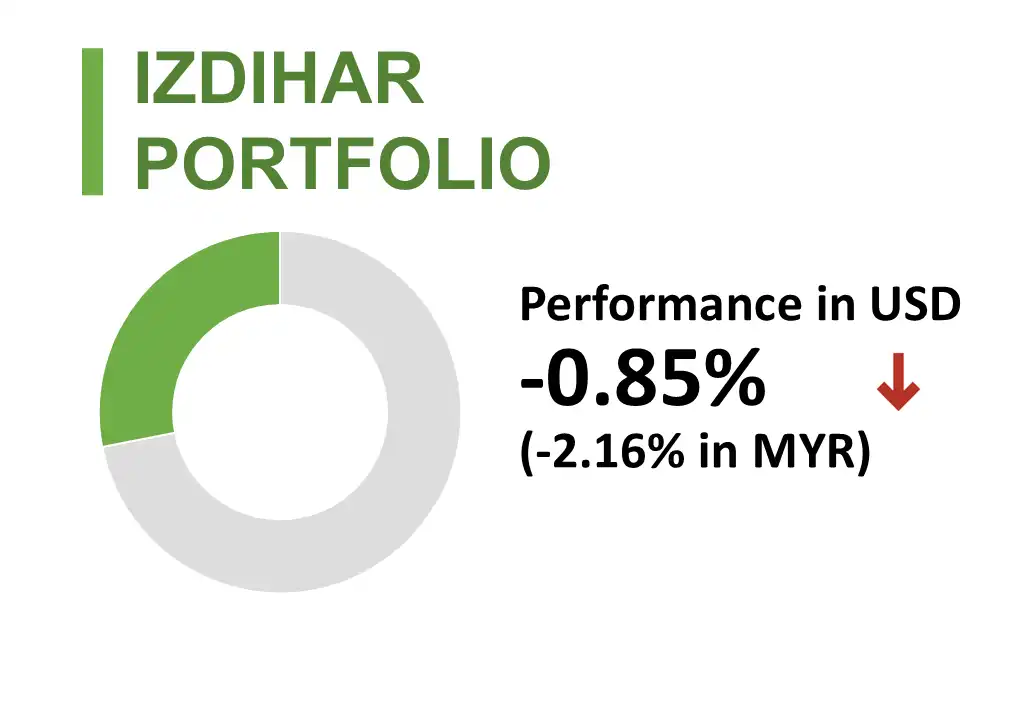
MYTHEO’s Izdihar portfolio dropped by 0.85% or decreased 2.16% in MYR.
This performance was mainly driven by the portfolio’s sizeable exposure to technology stocks, at a time when concerns over stretched valuations weighed on the sector. As a result, four out of the portfolio’s five exposures ended the month in negative territory.
The only asset within MYTHEO Izdihar that delivered a positive return was US Shariah stocks (HLAL). HLAL benefited from strong gains in its key holdings, particularly Apple and Alphabet, which rose 3.14% and 13.87%, respectively. Apple represented approximately 15.50% of HLAL’s holdings, while Alphabet accounted for 12.50%.
Top 3 ETFs performance (Izdihar products portfolio)
WAHED FTSE USA SHARIAH ETF (HLAL)
SP FUNDS S&P 500 SHARIA INDUSTRY EXCLUSIONS ETF (SPUS)
WAHED DOW JONES ISLAMIC WORLD ETF (UMMA)
+1.55%
-0.65%
-0.80%
Bottom 3 ETFs performance (Izdihar products portfolio)
SP FUNDS S&P GLOBAL TECHNOLOGY ETF (SPTE)
SP FUNDS S&P WORLD (EX-US) ETF (SPWO)
WAHED DOW JONES ISLAMIC WORLD ETF (UMMA)
-4.27%
-2.26%
-0.80%
Source: GAX MD Sdn Bhd, data in USD term for the month of November 2025.
Chart 1: YTD Portfolio Return in % (MYR)
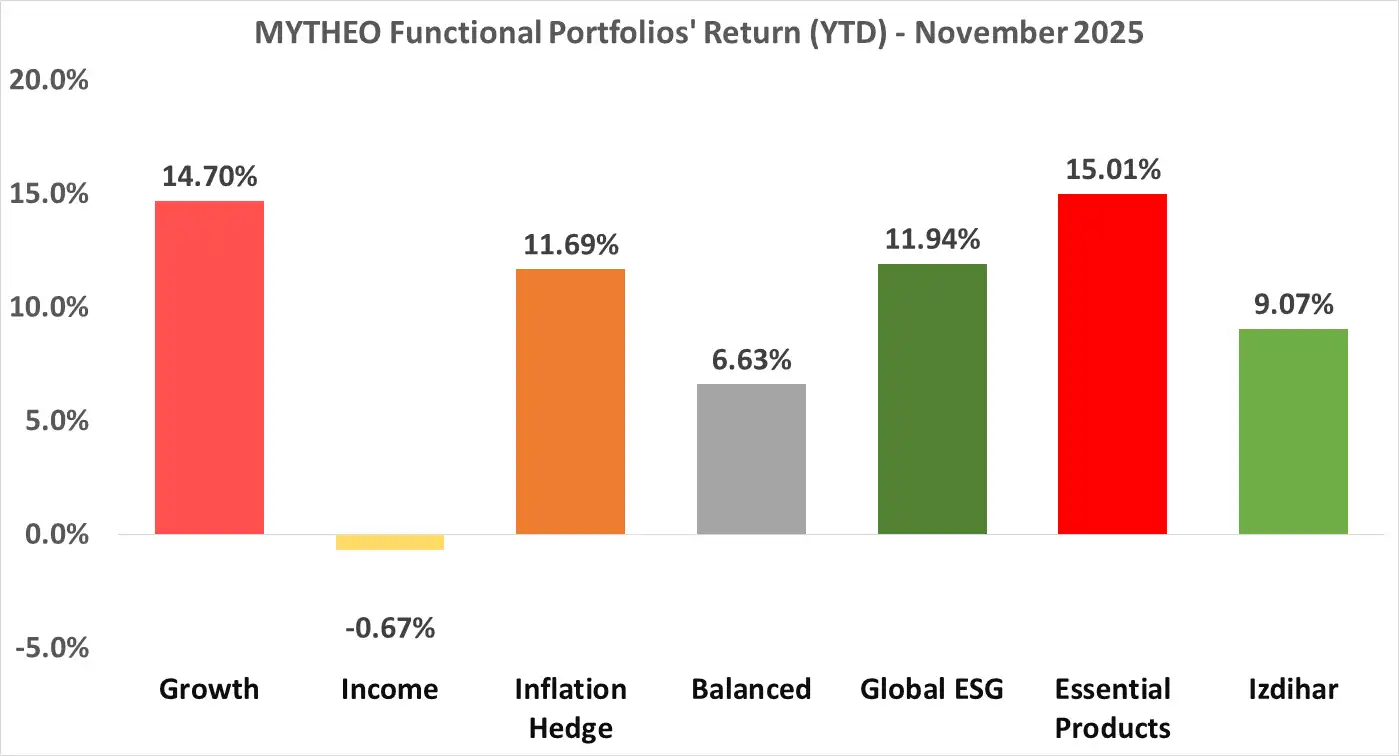
Source: GAX MD Sdn Bhd, November 2025
Note: Past performance is not an indication of future performance
Balanced allocation consists of 30% Growth, 47% Income and 23% Inflation Hedge
The Izdihar portfolio YTD performance is calculated from July 17, 2025, aligning with its official launch date.
How to calculate MYTHEO Omakase actual year-to-date (YTD) portfolio return
For MYTHEO Omakase, the actual portfolio returns derive from the combined weighted returns of each allocated functional portfolio.
For instance, assuming allocations of 30% to the Growth portfolio, 47% to the Income portfolio and 23% to the Inflation Hedge Portfolio, the YTD portfolio return in MYR as of November would be 6.63%. [(30% x 14.70%) + (47% x -0.67%) +(23% x 11.69%)]
Our Thoughts
November’s market dynamics reflect two key developments. First, the sell-off was concentrated mainly in selected technology stocks where valuations had run ahead of fundamentals, rather than indicating broad market weakness. Second, investors shifted capital toward value, mid-cap, and income-oriented exposures. Within technology, companies with more reasonable valuations continued to perform well, as seen in the strong performance of Alphabet, Broadcom, and Apple.
For Malaysian investors with foreign exposure, currency movements also played a role. The Ringgit was one of the strongest currencies in November, appreciating 1.34% against the US Dollar. This strength resulted in slightly lower USD-based investment returns when translated into MYR, although this effect is generally short-term. Historically, since 2006, the USD’s annualised appreciation against the MYR has averaged only 0.44%, indicating that currency impact tends to moderate over longer periods.
Source: GAX MD Sdn Bhd, November 2025
Despite the sell-off in technology stocks, MYTHEO portfolios remained resilient. Our algorithms are designed to diversify not only across geographical regions, but also across themes and investment strategies. As a result, MYTHEO successfully captured and benefited from the market rotation into value, mid-cap, and high-yields assets. This outcome provides strong evidence of the strength of MYTHEO’s risk-managed, diversified investment framework in adapting to changing market conditions.
Discover how MYTHEO can enhance your portfolio diversification today and embark on your financial journey with confidence. Take the first step towards your financial goals now.
This material is subject to MYTHEO’s Notice and Disclaimer.