Thursday, 18 February 2021
Written by Amirudin Hamid, Portfolio Manager of GAX MD

A clash between hedge fund managers and retail investors in the GameStop trading frenzy gained so much attention in January 2021 and the market had a roller coaster ride in the final week of the month. Moreover, Asian equities continued to outperform United States (US) equities.
The Growth and Inflation Hedge portfolios rose by 1.81% and 1.49% respectively while the Income portfolio declined by 0.44%.
Chart 1: Performance of Major Equity Indices in Respective Local Currency for Jan 2021
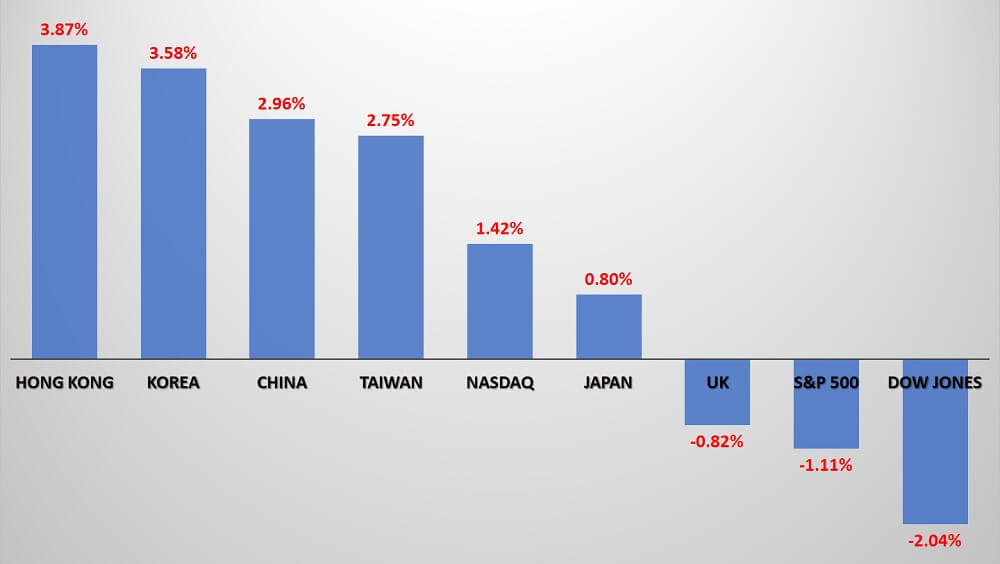
Source: GAX MD Sdn Bhd, TradingView, February 2021
Note: Past performance is not an indication of future performance
The economic report showed that the US economy is out of recession with a 4% growth in Q4 of 2020. However, slower activities in the first half of the year resulted in the economy contracting by 3.5% for the full-year 2020, which is the first decline since 2009.
The Federal Open Markets Committee (FOMC) left interest rates unchanged during its meeting in January 2021. In a post-meeting conference, the FOMC chairman, Jerome Power, said that the economy is still a long way from a full recovery and that the FOMC remained committed to keeping the monetary policy loose. Also, he reassured investors that the Quantitative Easing (QE) program of monthly purchases of at least US$120 billion in debt will continue in the foreseeable future.
Chart 2: Functional Portfolios’ Performances for the month of January 2021
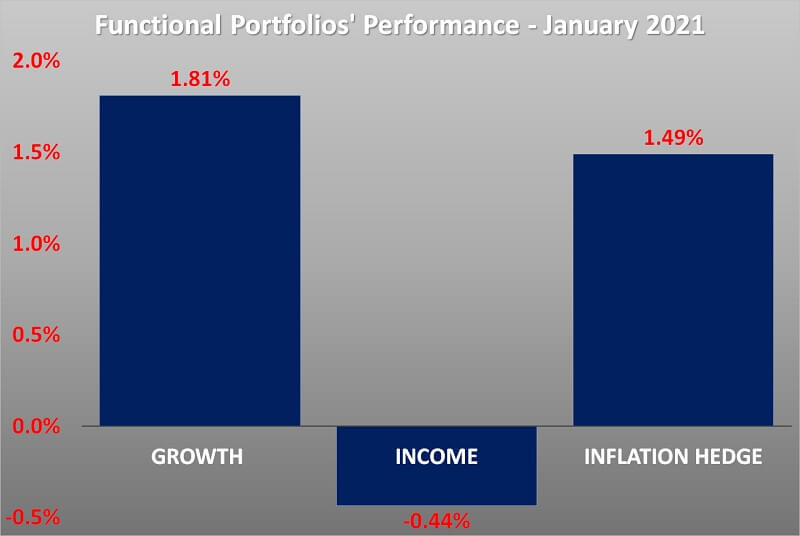
Source: GAX MD Sdn Bhd, February 2021
Note: Past performance is not an indication of future performance
The GROWTH portfolio rose by 1.81% in MYR
The Growth portfolio returned 1.81% in January 2021, and the positive performance was derived substantially from outsized gains through the exposure in Asia such as China (FXI), Taiwan (EWT), and Frontier Market (FM).
FXI surged 6.83% after China reported stronger than expected economic growth of 6.5% in the fourth quarter last year. Again! EWT edged further higher by 4.77% driven by the rally of chip-making companies, such as Taiwan Semiconductor and Mediatek.
A 7.58% spike in crude oil price sent FM up by 2.72%. More than 25% of FM's assets are in Kuwait - a country in which oil contributes about 70% of its total export value.
US Value stocks (VTV) and Japan stocks (EWJ) were the only exposures with negative returns in January 2021, but the losses were relatively small at -0.36% and -0.30%, respectively.
The INCOME portfolio dipped by 0.44% in MYR
The US 10-year Treasury yield rose above 1% for the first time since February 2020. As a result, all Treasury ETFs were down across the board. Long-term treasury bonds (TLT), Emerging Market Bonds (EMLC), and International Treasury (IGOV) all dropped by 3.16%, 1.36% and 1.10%.
However, riskier Bonds such as High yield bonds (HYG) and Short-term High Yield bonds (SJNK) finished higher as investors added more risks in the search of higher returns. SJNK and HYG wrapped up the month 0.60% and 0.11% higher.
The INFLATION HEDGE portfolio increased by 1.49% in MYR
The performance of the components inside the Inflation Hedge fund was mixed. Profit-taking activities hit gold (IAU), Metal Crude Oil (DBO) and Global Infrastructure (IGF) ETFs by 2.72%, 2.01% and 1.99% respectively.
However, the higher crude oil price was a sweet spot in the Inflation Hedge portfolio. Crude Oil ETF (DBO) rose by 8.12%, and iShares Global Clean Energy (ICLN) spiked up by 5.52%. ICLN is an ETF that we have included in the portfolio earlier this year. The ETF offers exposure to companies that produce energy from solar, wind, and other renewable sources. As clean energy is a long-term substitute for crude oil, the ETF and crude prices tend to move in the same direction.
It must be noted that, the actual portfolio returns to the investors is the combined weighted return from the allocation to each functional portfolio. For example, if an investor allocates the investment equally: 33.3% in Growth, 33.3% in Income and 33.3% in Inflation Hedge, the actual portfolio return is (33.3% x 1.81%) + (33.3% x-0.44%) + (33.3% x 1.49%) = 0.95%
Note: Past performance is not an indication of future performance
Our thoughts
A trading frenzy on the online videogame retailer GameStop was the most unexpected event in January 2021. What a ridiculous surprise it was to watch professional hedge fund managers clash with a group of retail investors from the Reddit platform, with both parties taking the opposite sides of the trades. The hedge fund managers made a bet to profit from the falling of GameStop's shares by short-selling, in which they borrowed the shares and sold it in the open market.
On the other end, retail investors who had already owned the stock started to induce other members on Reddit's WallStreetBets discussion group to bid up the GameStop share, which led to the share price surging by more than 1,700% in less than a month. As a result, the hedge fund managers were forced to buy back the shares at a price multiple times higher and booked billions of dollars in losses.
Eventually, GameStock's share price reversed and at the time of writing (9 February 2021), the share price dropped by more than 81% from the closing price at the end of January 2021. Therefore, retail investors who were late into the game also ended up with significant losses.
In the end, there were massive losses on both sides - the buyers and the short-sellers! Very few came out as winners from this trading frenzy - the long traders that got their hand on the stock early and short traders that held the stock long enough until the share price collapsed. But the majority of the traders had their money and wealth perished in less than a month.
Chart 3: Share Performance and Standard Deviation of GameStop share
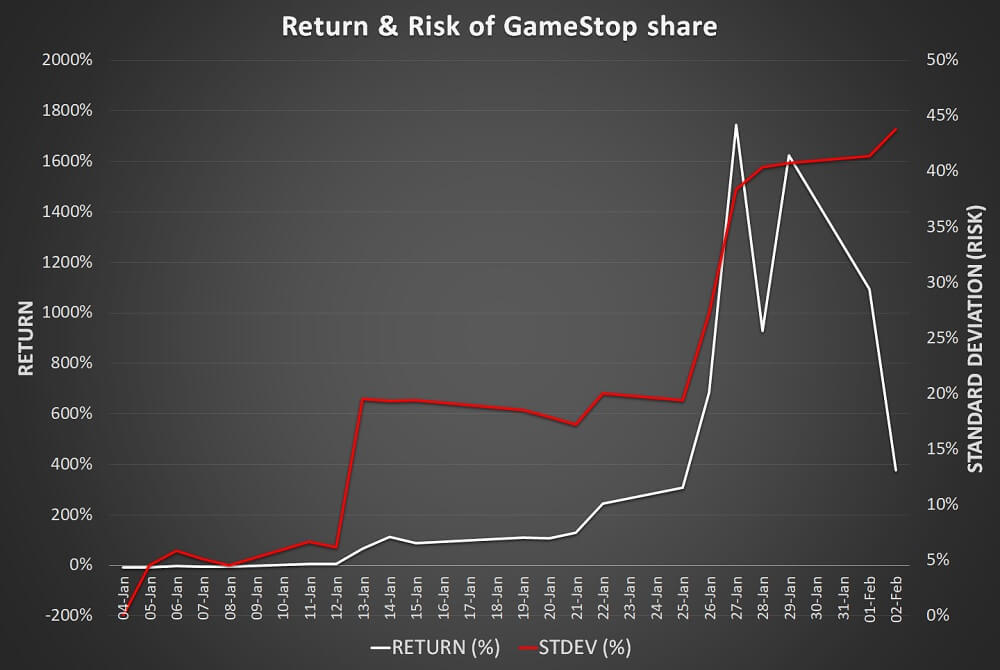
Source: GAX MD Sdn Bhd, TradingView, February 2021
Note: This is provided for information purposes only. It is not a recommendation to buy, hold or sell any security. Views, opinion are subject to change without notice.
How did all this happen? From the chart above, we see that when the share price of GameStop surged, its standard deviation also rose. A high standard deviation indicates that it is getting riskier to hold on to the stock and the possibility of a share price correction has increased substantially. That was precisely what happened at the end of the month, in just a few days, the share price of GameStop plunged by more than 80%. Many investors were caught unprepared and it was impossible to avoid the losses, given how quickly the share price had reversed.
This is precisely what MYTHEO’s algorithms help investors to avoid - a potential financial loss due to irrational behaviour. MYTHEO’s algorithms are created with the primary objective to minimize portfolio risks. These MYTHEO’s algorithms continuously monitor the investment by calculating the risk or standard deviation of every ETF in the portfolio. Therefore, whenever any ETF is getting too "hot" or trading at excessive risks, the MYTHEO’s algorithms will automatically reduce or remove the ETF from the portfolio.
Hence, with MYTHEO, investors are always protected against a drastic move in the share price and any unnecessary risks. As such, investors can achieve their long-term financial objectives with a peace of mind.
Disclaimer: This material has not been reviewed by the Securities Commission Malaysia. MYTHEO investors may still be exposed to investment risks. Future investment returns cannot be guaranteed.