Friday, 18 October 2022
Written by Sonia Tan, Portfolio Manager of GAX MD

In this monthly report, we will review MYTHEO’s portfolio performances based on the financial market developments in September 2022.
1. Growth Portfolio
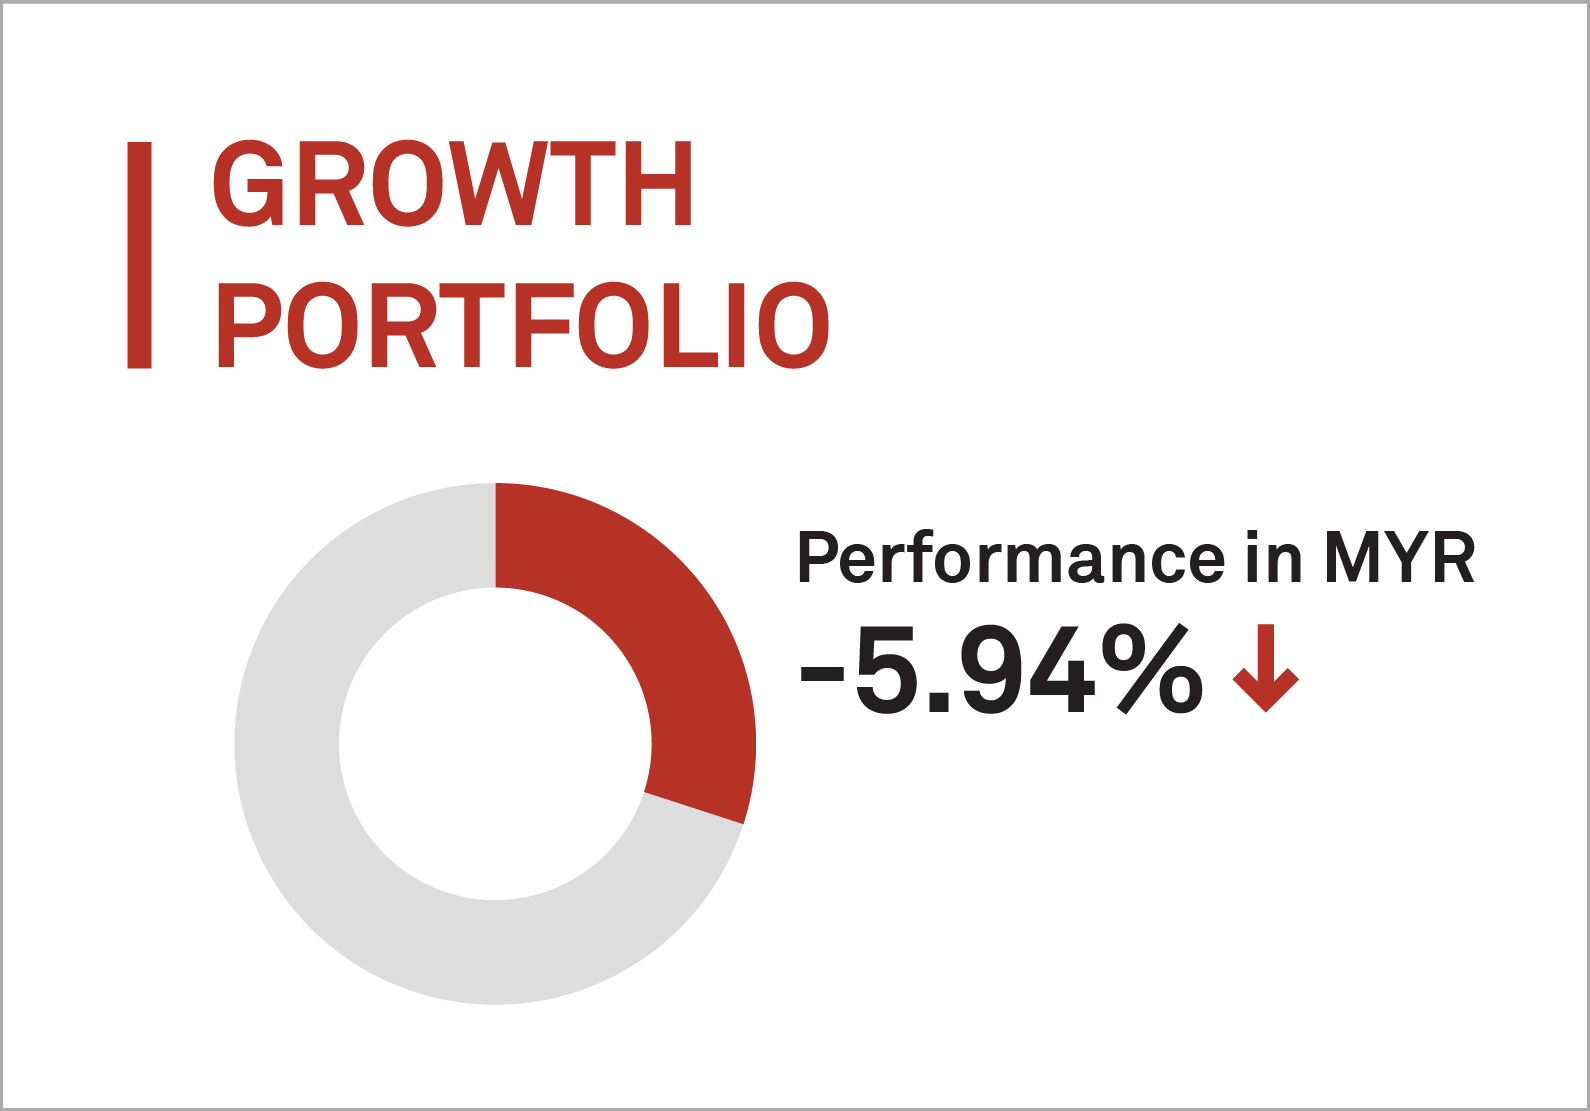
MYTHEO’s Growth Portfolio was down 5.94% (in MYR) in September 2022, as the sell-off in the U.S stock market intensified in September. The S&P 500 was firmly in the bear market territory at the end of September, down 9.33% and is at its lowest level since November 2020. Meanwhile, Nasdaq composite slid 10.25% to 10,576.62 and Dow Jones Industrial Average dropped 8.82% to 28,730.12 points.
In Foreign Exchange (FX) markets, DXY (an Index measuring the value of the US dollar vs major global currencies) climbed to its highest point since June 2002. Malaysia Ringgit gave up ground versus the US dollar in September by 3.6% to RM4.635 on 30th September 2022, compared to RM4.474 on 31st August 2022.
Top 3 ETFs (Growth portfolio)
ISHARES MSCI MEXICO (EWW)
WISDOMTREE INDIA EARNINGS (EPI)
VANGUARD VALUE ETF (VTV)
-0.55%
-5.77%
-8.42%
Bottom 3 ETFs (Growth portfolio)
ISHARES MSCI SOUTH KOREA (EWY)
ISHARES CHINA LARGE-CAP ETF (FXI)
ISHARES RUSSELL 2000 VALUE (IWN)
-18.22%
-14.40%
-10.89%
The performance of ETFs in USD is slightly weaker than in MYR. This is because the Ringgit has weakened versus USD in recent months, causing the portfolio performance to be appreciated more in MYR.
2. Income Portfolio
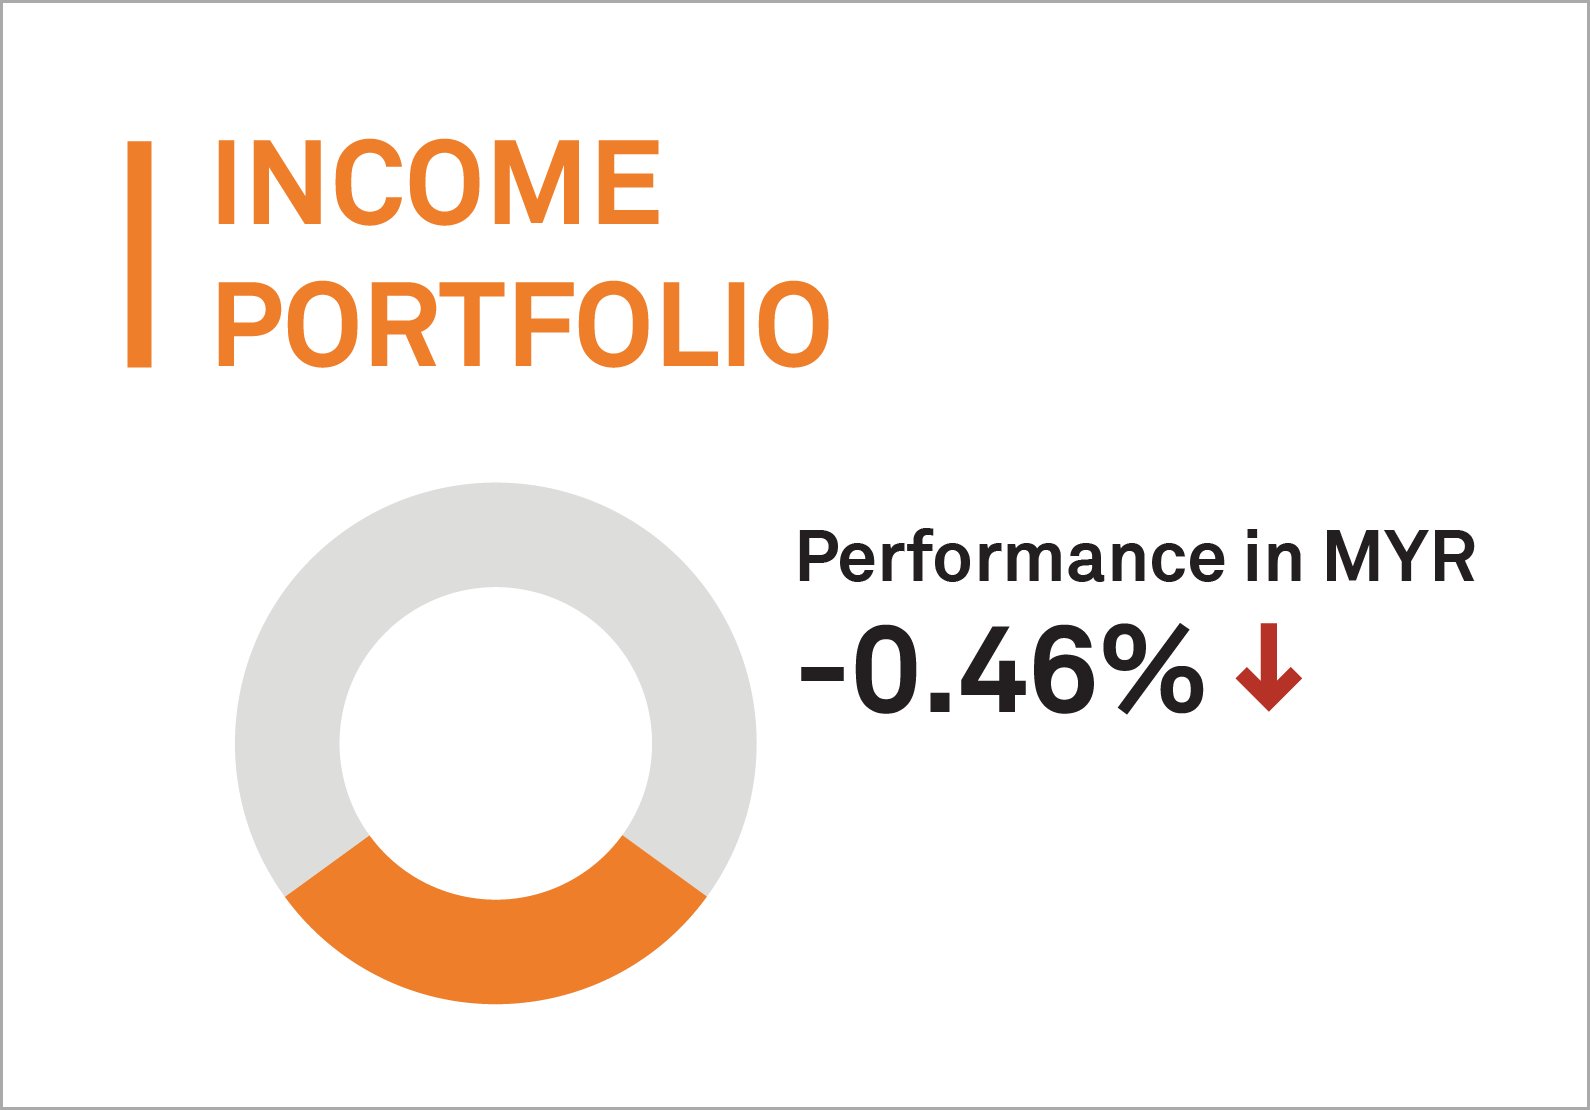
MYTHEO’s Income Portfolio recorded a negative return of 0.46% (In MYR) in September 2022. Most bond indices posted solidly negative returns for the third straight quarter. Continued Fed rate hikes and a late quarter selloff in global sovereign bonds (driven by the ill-conceived fiscal spending package from the United Kingdom) saw most bond classes end the third quarter lower, extending the year-to-date declines.
The Federal Reserve’s aggressive drive to bring inflation down to its 2% target will take years to complete and come at a cost of notably higher unemployment and slower economic growth. The Fed’s latest quarterly summary of policymaker projections show that the U.S central bank expects to raise the policy rate, now in the 3%-3.25% range after the Fed announced a 75 basis point increase, to 4.4% by the end of this year and to 4.6% by the end of next year.
The yield on 10 Year US Treasuries rose from 3.20% to 3.82%, the yield on 10 Year Gilts rose from 2.80% to 4.09%.
Meanwhile, September CPI, which reflects August 2022 inflation data, came in at 8.3%, which was higher than the consensus forecast but lower than the two previous readings.
Top 3 ETFs (Income portfolio)
ISHARES 1- 5 YEARS INVESTMENT GRADE CORPORATE BOND (IGSB)
SPDR BLOOMBERG SHORT-TERM HIGH YIELD BOND (SJNK)
ISHARES 3-7 YEAR TREASURY BONDS (IEI)
-2.24%
-2.98%
-3.06%
Bottom 3 ETFs (Income portfolio)
ISHARES 20+ YEAR TREASURY BOND (TLT)
ISHARES IBOXX INVESTMENT GRADE CORPORATE BOND (LQD)
VANECK JP MORGAN EM LOCAL CURRENCY BOND (EMLC)
-8.43%
-6.24%
-5.35%
The performance for ETFs returns in USD are slightly weaker than MYR. This is due to the Ringgit has been weakened versus US dollar in recent month, causing the portfolio performance being appreciated more in MYR.
3. Inflation Hedge Portfolio
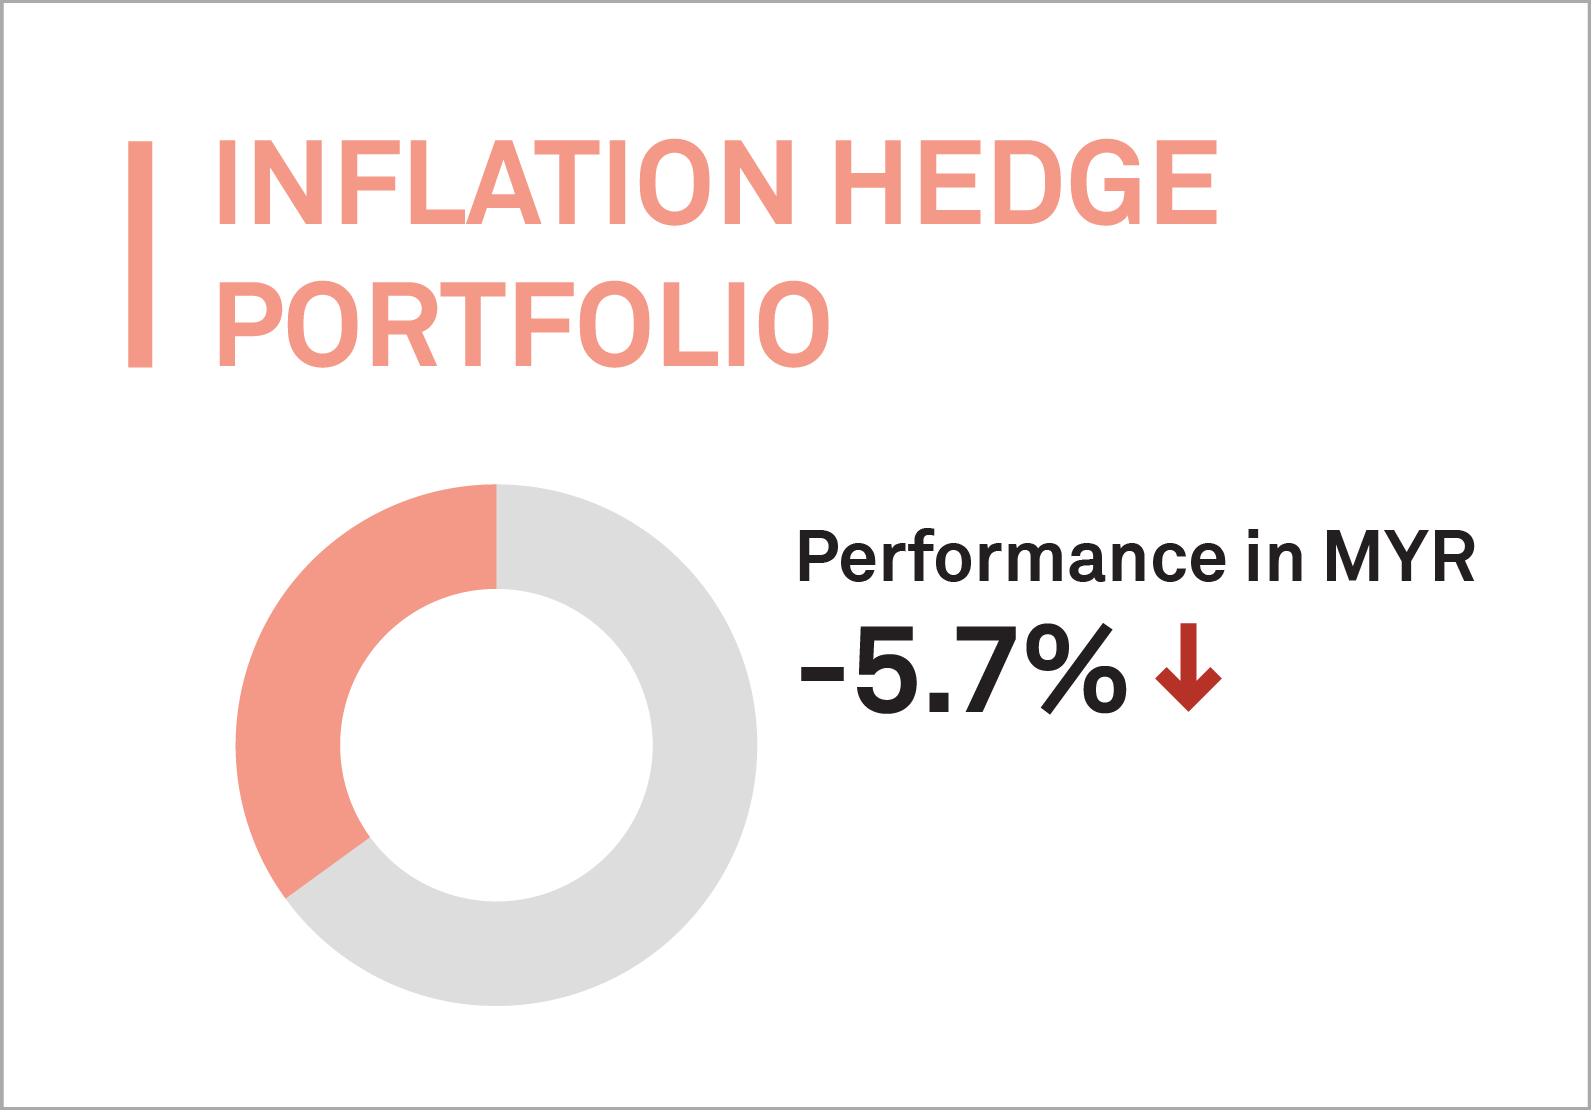
MYTHEO’s Inflation Hedge Portfolio saw a negative return in September 2022, edging lower by 5.7% (in MYR). The commodity market moved lower in Q3 but was still marginally higher than the level at the end of 2021. The US dollar is typically a significant driver for commodity prices, as it tends to have an inverse relationship with raw materials prices. As the US dollar continued its strength, oil prices fell by more than 11% with both copper and gold prices falling by about 3% each. A similar pattern was seen in Iron Ore which fell by 6.5% over the month. The “higher rates will lead to a global slowdown/recession” narrative came through in the recent commodity price action after the Jackson Hole symposium, where the Fed reiterated its commitment to stamp out inflation.
We could see lots of volatility in the energy and food sectors in the coming weeks as fighting inflation with monetary policy alone cannot really address the shortages created by the war in the “breadbasket” of Europe. This was evidenced by natural gas posting a gain of 25.85% and was 83% higher over the first nine months of 2022. Natural gas markets are expected to remain tight into 2023 as Russia further reduces supplies to Europe.
Top 3 ETFs (Inflation hedge portfolio)
ISHARES GOLD TRUST (IAU)
ISHARES TIPS BOND ETF (TIP)
INVESCO DB BASE METALS FUND (DBB)
-2.87%
-7.91%
-8.25%
Bottom 3 ETFs (Inflation hedge portfolio)
ISHARES MORTGAGE REAL ESTATE (REM)
ISHARES GLOBAL CLEAN ENERGY (ICLN)
ISHARES US REAL ESTATE (IYR)
-26.32%
-13.93%
-13.62%
The performance of ETFs in USD is slightly weaker than in MYR. This is because the Ringgit has weakened versus USD in recent months, causing the portfolio performance to be appreciated more in MYR.
4. Global ESG Portfolio
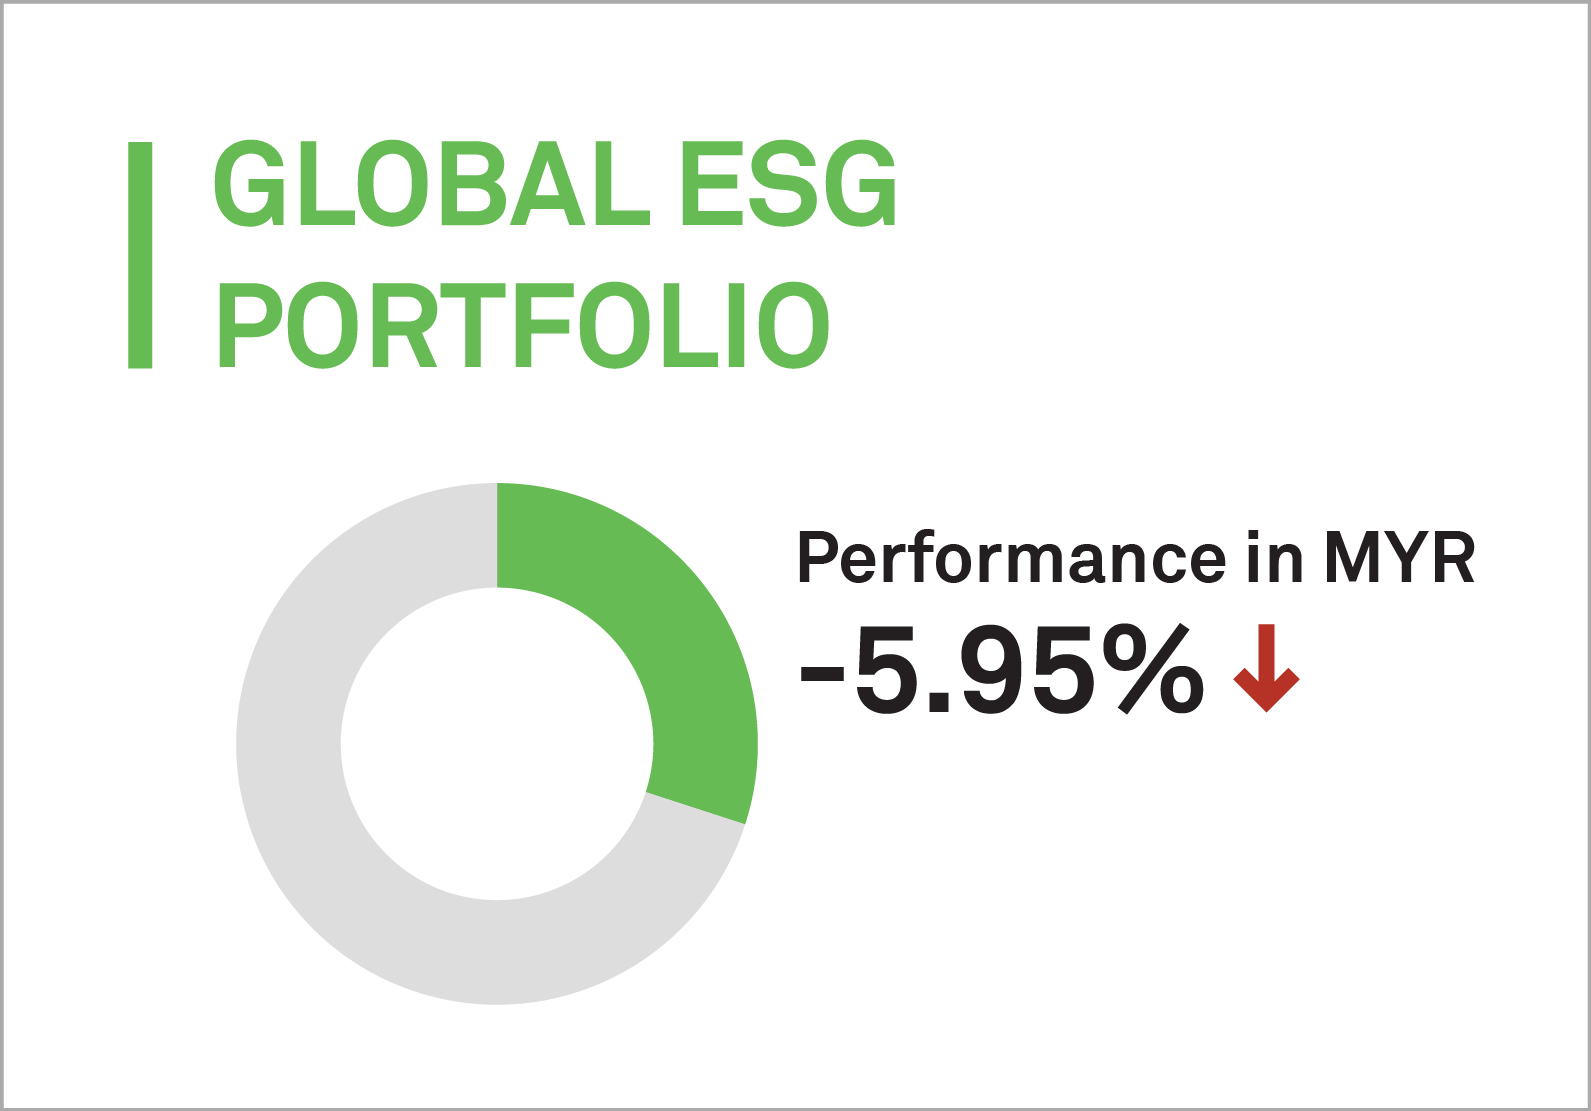
Similar to the Growth Portfolio, MYTHEO’s Global ESG portfolio was down by 5.95% (in MYR).
Top 3 ETFs (Global ESG portfolio)
NUVEEN ESG LARGE-CAP VALUE (NULV)
ISHARES ESG AWARE MSCI EAFE (ESGD)
NUVEEN ESG LARGE-CAP GROWTH (NULG)
-9.42%
-9.54%
-9.68%
Bottom 3 ETFs (Global ESG portfolio)
ISHARES ESG AWARE MSCI EM (ESGE)
ISHARES MSCI USA ESG SELECT (SUSA)
ISHARES ESG AWARE MSCI USA ETF (ESGU)
-11.85%
-10.34%
-9.97%
The performance of ETFs in USD is slightly weaker than in MYR. This is because the Ringgit has weakened versus USD in recent months, causing the portfolio performance to be appreciated more in MYR.
Chart 1: September 2022 - Portfolio Cumulative Rate of Return in % (MYR)
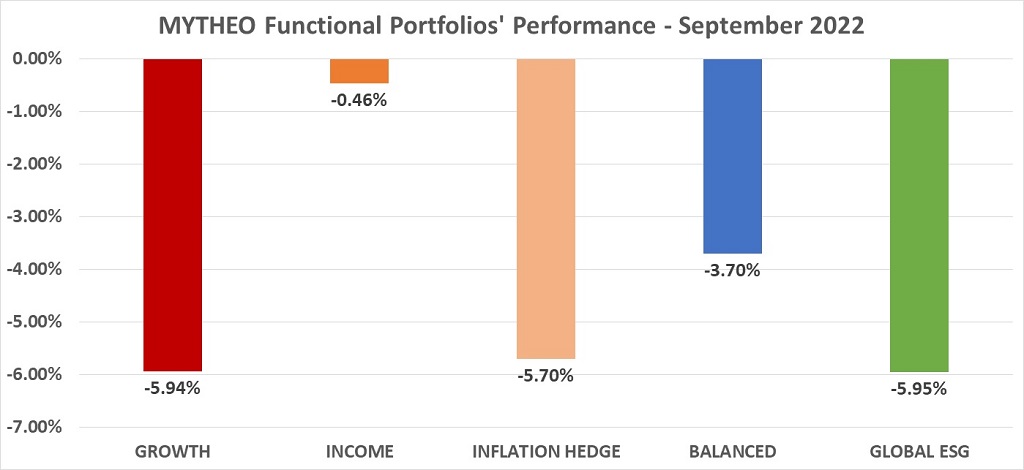
Balanced allocation consists of 40% Growth, 40% Income and 20% Inflation Hedge.
Source: GAX MD Sdn Bhd, October 2022
Note: Past performance is not an indication of future performance
Do you know how to calculate your actual monthly portfolio return?
As part of diversification, the actual portfolio returns to the investors are the combined weighted return from the allocation to each functional portfolio.
For example, if an investor allocates 40% of their investment in Growth, 40% in Income and 20% in Inflation Hedge, the actual monthly portfolio return is -3.70% [(40% x -5.94%) + (40% x -0.46%) + (20% x -5.70%)]
Our Thoughts
The reality must be considered in the context of a market that has declined substantially and presumably, already priced in a lot of bad news. Valuations on many quality companies are quickly approaching pre-pandemic levels, while the S&P 500 is trading at a valuation that is attractive over the longer term.
A review of history suggests the following:
1) Inflation has likely peaked. Multiple inflation indicators are showing a peak and decline in price pressures, and while the consumer price index remains far above the Fed’s target of 2%, any swift deceleration in inflation would likely be a material positive catalyst for both stocks and bonds.
2) The less-aggressive Fed pivot will still occur. According to the Fed’s estimates, interest rate increases will begin to slow in the coming months. If that turns out to be the case, and the Fed signals to markets that this rate hike cycle is approaching its end, that will likely be a materially positive catalyst for both stocks and bonds.
3) Geopolitical tensions remain very elevated, but most western countries remain united in their opposition to the Russian invasion of Ukraine. Any reduction in geopolitical tensions would provide a surprise boost for global risk assets, including U.S stocks and bonds.
Amidst a difficult macroeconomic backdrop, the U.S economy and corporates have proven impressively resilient. Most measures of U.S economic growth remain in solid shape. While U.S corporate earnings estimates have stayed largely elevated, the widespread earnings declines that were feared back in early 2022 simply have not materialized.
Having said that, fighting inflation remains the central banks’ top priority. This makes a recession and further near-term downside in equities more likely, with the debate shifting to whether such a recession is going to be shallow (which is likely priced in) or deep. History shows us that peak-to-trough drawdowns for the S&P 500, for instance, have been as small as 20% (similar to this year’s move) in milder recessions like 1990 or as large as over 50% in 2008, an unusually deep recession. Fed policy, which remains aggressively focused on responding to inflation for now, risks tightening policy to the point where a recession is no longer shallow. The Fed’s approach raises risk of further near-term downside in equities.
Therefore, managing risk is extremely important in the current environment. Having a well-balanced, diversified portfolio, with a risk profile consistent with your goals, and being prepared with a plan in the event of an unexpected outcome are keys to successful investing. Meanwhile, risk managing via cash and cash-like assets can help navigate a difficult near-term outlook.
MYTHEO’s Omakase portfolio combines Growth, Income and Inflation Hedge functional portfolios based on your goals. It offers global diversification to protect against extreme fluctuations in any single asset class, diversifying your portfolio into alternative assets which offer a better cushion from the volatility in the equity market. Meanwhile, the newly launched MYTHEO USD Cash Trust portfolio can make periods of high volatility more tolerable by providing an avenue for investors to diversify away from riskier investments into safe haven USD Cash.
A digital investment platform like MYTHEO is here for you to achieve your long-term financial targets by having diversified investments in an easy and affordable way. Learn how MYTHEO can help you diversify your portfolio today, and how you can get started here.
This material is subjected to MYTHEO's Notice and Disclaimer.