Key Takeaways
- September was defined by concentrated tech outperformance driven by AI product catalysts and dealmaking, allowing MYTHEO Izdihar to lead as the sole positive portfolio.
- A sharp surge in global sovereign bond yields triggered a broad repricing, creating headwinds across duration-sensitive assets including fixed income, REITs, infrastructure, and non-yielding precious metals.
- Despite broad market weakness, diversification benefits remained visible as energy exposure and floating-rate debt provided pockets of resilience across MYTHEO portfolios.
Monthly Returns Summary
The following table summarises the performance of all MYTHEO portfolios for September 2026:
1. Omakase Portfolios
Omakase combines Growth, Income & Inflation Hedge in an optimised weightage proportion that is personalised according to your risk profile. Your return is the weighted sum of these three functional portfolios.
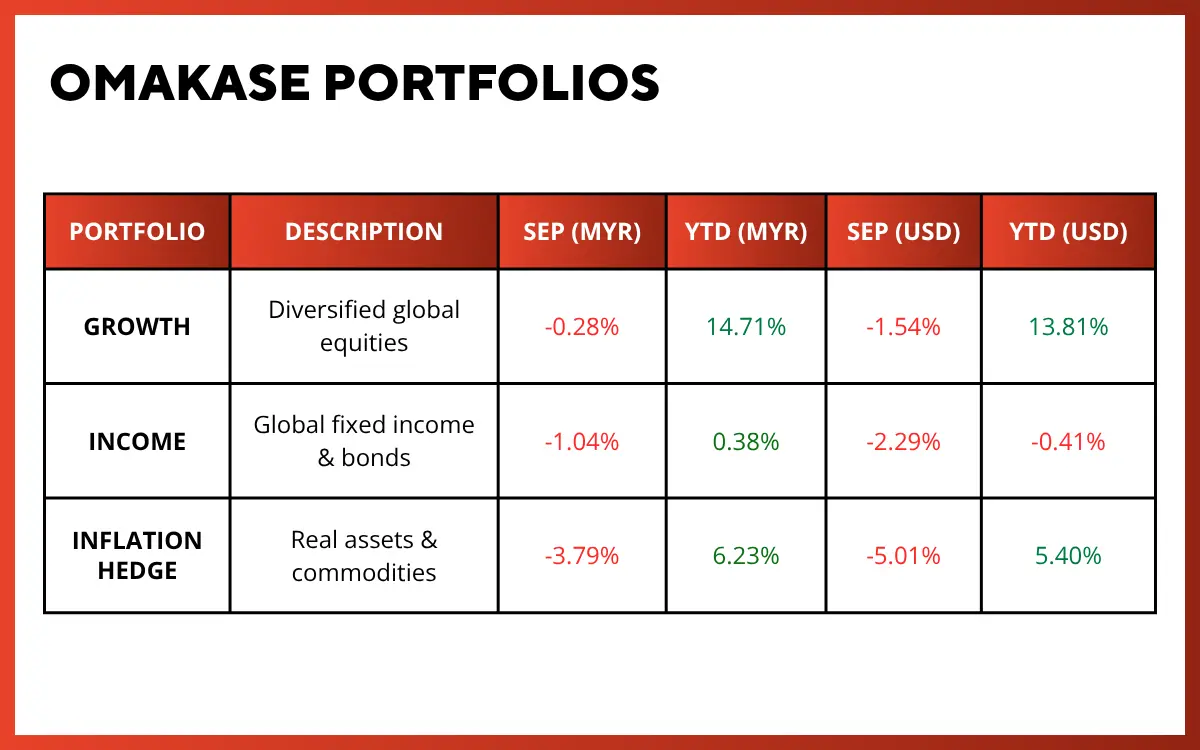
*Source: GAX MD Sdn Bhd, data in USD term for the month of September 2026
Past performance is not an indication of future performance.
2. Satellite Portfolios
Global ESG, Essential Products, and Izdihar are standalone portfolios — each with its own investment theme. They can be held independently or alongside an Omakase allocation.
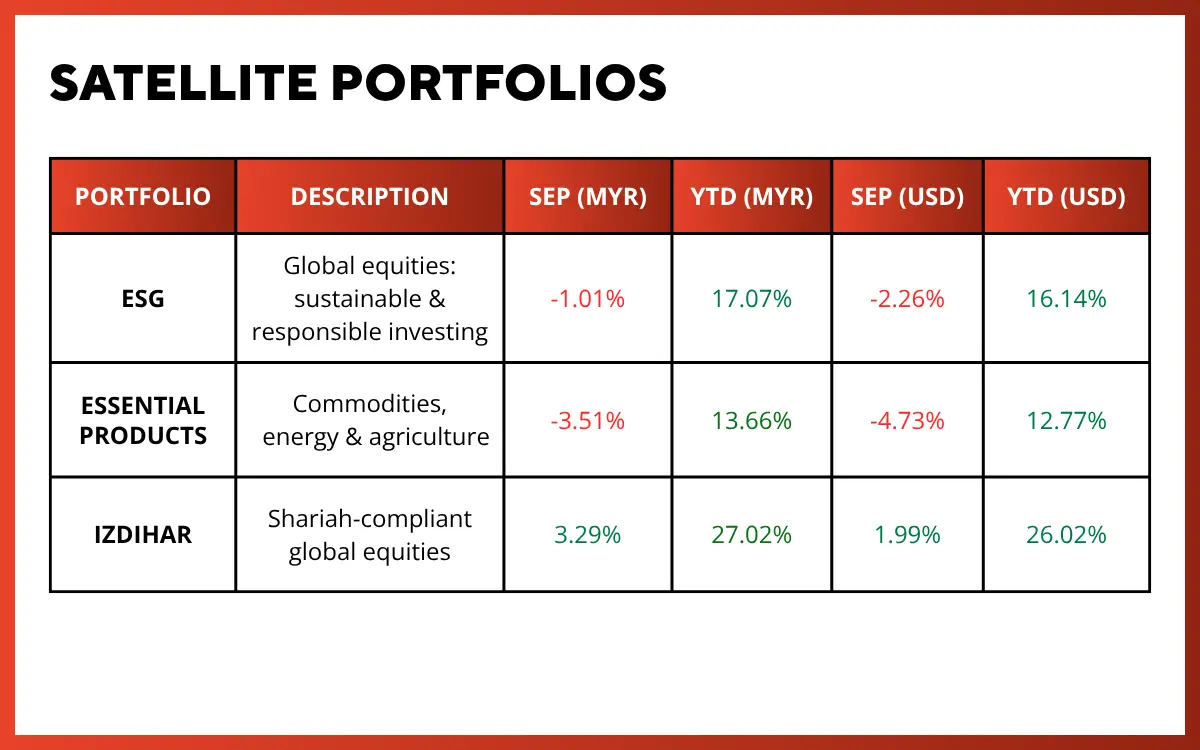
*Source: GAX MD Sdn Bhd, data in USD term for the month of September 2026
Past performance is not an indication of future performance.
3. MYTHEO Portfolio YTD Returns in MYR
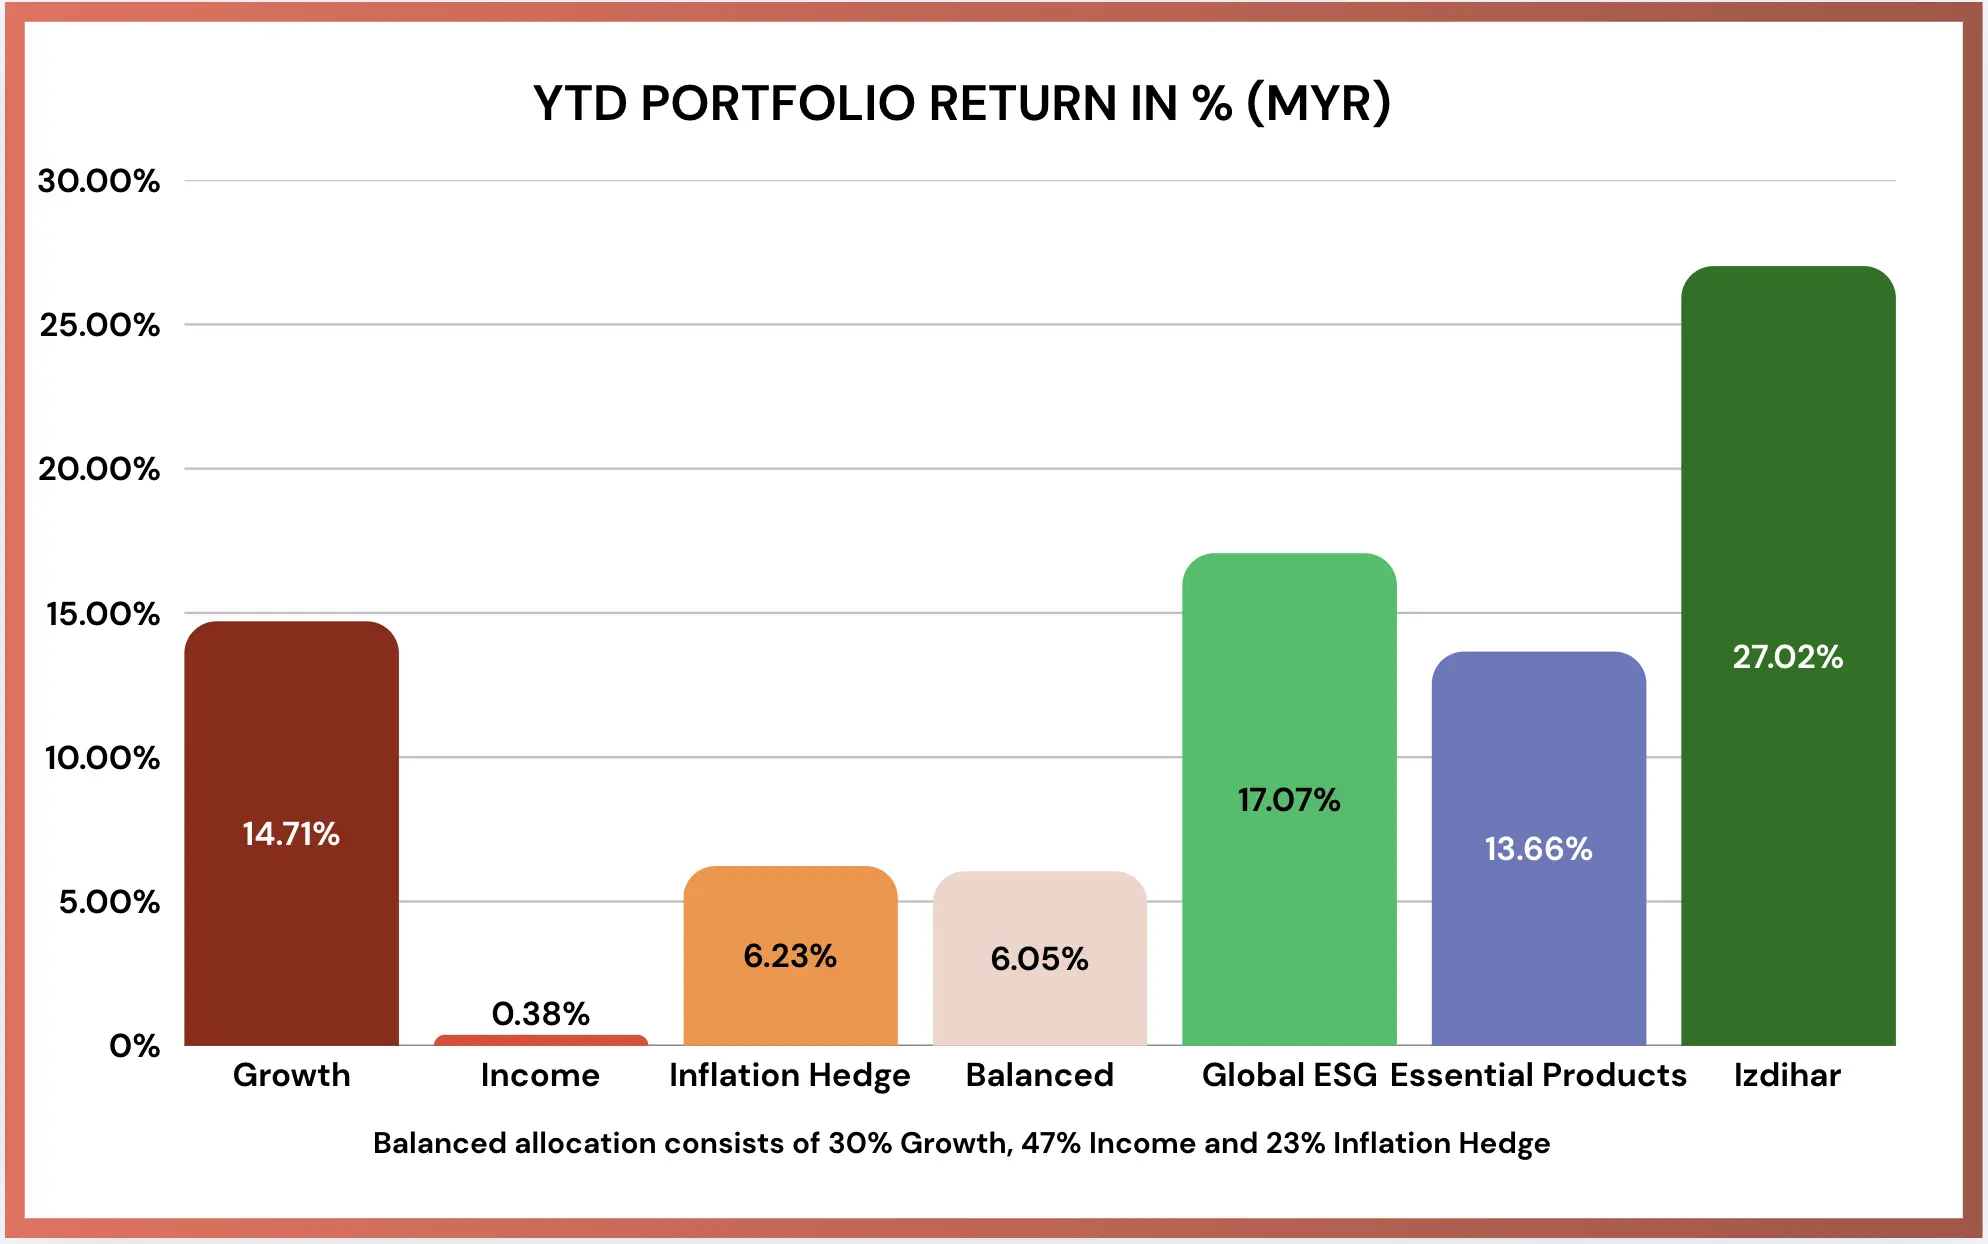
*YTD = Year to Date
*Source: GAX MD Sdn Bhd, data in USD term for the month of September 2026
Past performance is not an indication of future performance.
HOW TO CALCULATE YOUR OMAKASE RETURNS
Your Omakase return is the weighted sum of each portfolio's monthly return. Using the balanced allocation as an example:
Assuming allocations of 30% to Growth, 47% to Income and 23% to Inflation Hedge, the YTD return in MYR as of September 2026 would be 6.02%. [(30% x 14.71%) + (47% x 0.38%) + (23% x 6.23%)].
Your actual return varies based on your personal allocation and investment timing.
Performance Commentary
September was a challenging month for investors, with most asset classes ending lower as rising interest rates and bond yields weighed heavily on market sentiment. The notable exception was the technology sector, where a series of product breakthroughs and merger and acquisition (M&A) developments among several large-cap companies continued to attract investor interest despite an otherwise negative market backdrop.
The month's biggest catalyst came from Meta Platforms after introducing its Meta Muse AI architecture, fuelling renewed interest across AI enterprise applications and driving Meta equity up 26.80%. M&A activity further boosted the positive sentiment within the AI sector, highlighted by Advanced Micro Devices agreeing to purchase World Labs for US$8.2 billion, which sent AMD shares higher by nearly 30%. Apple added further strength following its product refresh, which introduced the iPhone Duo foldable phone alongside the iPhone 18 Pro series, lifting Apple shares by 5.10%. Outside the technology sector, however, market performance was broadly negative. Rising interest rates, higher bond yields, and tighter financial conditions continued to pressure both growth-sensitive and income-generating assets, resulting in widespread weakness across global markets.
1. MYTHEO Izdihar Portfolio Supported by Rally in Technology Stocks
The divergence between technology stocks and the broader equity market was clearly reflected across the MYTHEO portfolios.
MYTHEO Izdihar was the only portfolio to deliver a positive return during the month, supported by its higher allocation to global technology companies. The portfolio's strongest contributor was global technology equities (SPTE), which gained 5.26%, benefiting from its significant exposure to Apple and AMD. Meanwhile, US Shariah equities (HLAL) advanced 3.11%, supported by strong gains in Meta, one of its key holdings.
The Growth Portfolio also benefited from its exposure to technology-related sectors. Growth equities (VUG) rose 2.22%, while Pacific equities (VPL) gained 0.31%, supported by strong performances from semiconductor and AI-related companies across Taiwan, South Korea, and Japan.
However, broader weakness across global equity markets outweighed these gains, resulting in a negative return for the Growth Portfolio. Most notably, exposures to smaller markets as well as small and mid-cap non-technology stocks were the largest detractors from overall portfolio performance during the month.
The ESG Portfolio also faced general risk aversion, with seven of eight constituent holdings finishing lower. Emerging Market ESG equities (ESGE) provided the lone positive return at 0.31%, buoyed by resilient semiconductor holdings including Samsung Electronics, SK Hynix, and Taiwan Semiconductor Manufacturing Company, which each advanced over 3%.
2. Commodity Winners Could Not Offset Real Asset Weakness
While technology dominated equity markets, energy was one of the few areas outside the sector to generate positive returns. The Inflation Hedge Portfolio benefited from its exposure to oil through the Invesco DB Oil Fund (DBO), which gained 7.91%. However, the positive contribution from energy was counter-balanced by steep declines across real estate-related investments.
Mortgage REITs (REM) led declines with a loss of 13.98%, followed by US real estate (IYR) and international real estate (RWX), which fell 6.71% and 6.02%, respectively. Rising bond yields increased financing costs and reduced the relative attractiveness of income-producing real estate assets, creating significant pressure across the sector.
Precious metals also struggled in the higher-rate environment. Gold (IAU) declined 6.70%, while silver fell 9.35% as investors reduced exposure to assets that do not generate income while bond yields continued to rise.
3. Capital-Intensive Industries Struggled in a Higher-Rate Environment
The Essential Products Portfolio was similarly constrained by rising interest rates and higher bond yields during the month.
Battery value chain exposure through the Global X Lithium & Battery Tech ETF (LIT) dropped 10.41%, relinquishing previous August gains as concerns surfaced over automotive financing costs slowing global electric vehicle adoption.
Capital intensive holdings across utilities, clean power, and water infrastructure also weakened. Because these sectors rely extensively on debt financing to develop infrastructure assets, rising debt service costs prompted a downward reassessment of future operating cash flows.
4. Income Portfolio Faces Pressure from Rising Rates
Sovereign bonds across global markets came under significant pressure, with longer-duration exposures experiencing the sharpest declines. Within the MYTHEO portfolio, US Treasury bonds with maturities exceeding 25 years (TLT) fell 5.38%, while international Treasury exposure (IGOV) declined 3.49%. The non-US bond exposures faced an additional headwind from the strengthening US dollar, further pressuring returns.
Despite benchmark yield pressure across global fixed income markets, the portfolio's strategic asset allocation into non-Treasury fixed income assets helped cushion portfolio returns. Floating rate debt (FLOT) gained 0.36% as coupon distributions adjusted upward with prevailing benchmarks, while senior secured loans (SRLN) and short duration corporate bonds (IGSB) experienced minimal drawdowns of 0.38% and 1.27% respectively.
5. Conclusion
September was a challenging month for investors, with rising Treasury yields and tighter financial conditions creating broad-based weakness across global markets. While a handful of technology companies continued to benefit from strong AI-related optimism and corporate developments, most asset classes, including equities, bonds, real estate, precious metals, and infrastructure, faced significant headwinds. This was reflected across the majority of MYTHEO portfolios, with MYTHEO Izdihar standing out as the only portfolio that generated positive returns during the month.
However, investors should recognise that periods such as these are a normal part of long-term investing. Markets do not move in a straight line, and temporary corrections occur regularly as investors reassess economic conditions, interest rate expectations, and growth prospects. In fact, our analysis identified six corrections over the past three years where market drawdowns exceeded 5%. We will discuss these episodes and their investment implications in greater detail in our upcoming CIO Insight publication later this month.
Market corrections can be uncomfortable, but they also create opportunities to accumulate quality investments at more attractive valuations. For investors with a long-term horizon, maintaining a consistent investment approach is often more important than attempting to predict short-term market movements. MYTHEO's Regular Savings Plan is designed to support this discipline by helping investors build their portfolios steadily through regular contributions regardless of market conditions.
By combining systematic multi-asset portfolio rebalancing with automated regular investing, MYTHEO helps investors reduce emotional decision-making, remain disciplined through market cycles, and stay positioned to benefit from eventual market recoveries.
*This material is subject to MYTHEO's Notice and Disclaimer. All performance figures are net of management fees. Past performance is not indicative of future results.
Appendix
ETF Performance Summary by Portfolio | September 2026
1. Growth Portfolio
RISK: HIGH | Diversified global equities
2. Income Portfolio
RISK: LOW | Global fixed income & bonds
3. Inflation Hedge Portfolio
RISK: MEDIUM | Real assets & commodities
4. ESG Portfolio
RISK: HIGH | Global equities — sustainable & responsible investing
5. Essential Products Portfolio
RISK: HIGH | Commodities, energy & agriculture
6. Izdihar Portfolio
RISK: HIGH | Shariah-compliant global equities
*Returns are in USD terms for the month of September 2026.
Top and Bottom performers ranked by 1-month return within each portfolio. Past performance is not indicative of future results.
Ready to explore how MYTHEO works for your goals? Learn more here.
Or download our app so you can start investing in a moment. Download on iOS here or Android here.
*This material is subject to MYTHEO's Notice and Disclaimer. All performance figures are net of management fees.
Past performance is not indicative of future results.
This material is subject to MYTHEO’s Notice and Disclaimer.