Key Takeaways
- October witnessed a rotation away from growth and artificial intelligence equities into value stocks. MYTHEO Izdihar recorded the largest monthly pullback among the six portfolios, yet it preserved the strongest year-to-date return across the lineup.
- Government bonds rebounded as Treasury yields retreated from September peaks. Income led monthly portfolio performance with gains of 1.37% in USD and 0.59% in MYR, even with the Federal Reserve holding its benchmark policy rate steady.
- Energy rallied as geopolitical tensions in the Middle East supported crude oil prices, while precious metals and clean energy holdings pulled back. Currency translation lowered MYR returns relative to USD across all strategies, leaving only the Income portfolio positive in MYR terms for the month.
Monthly Returns Summary
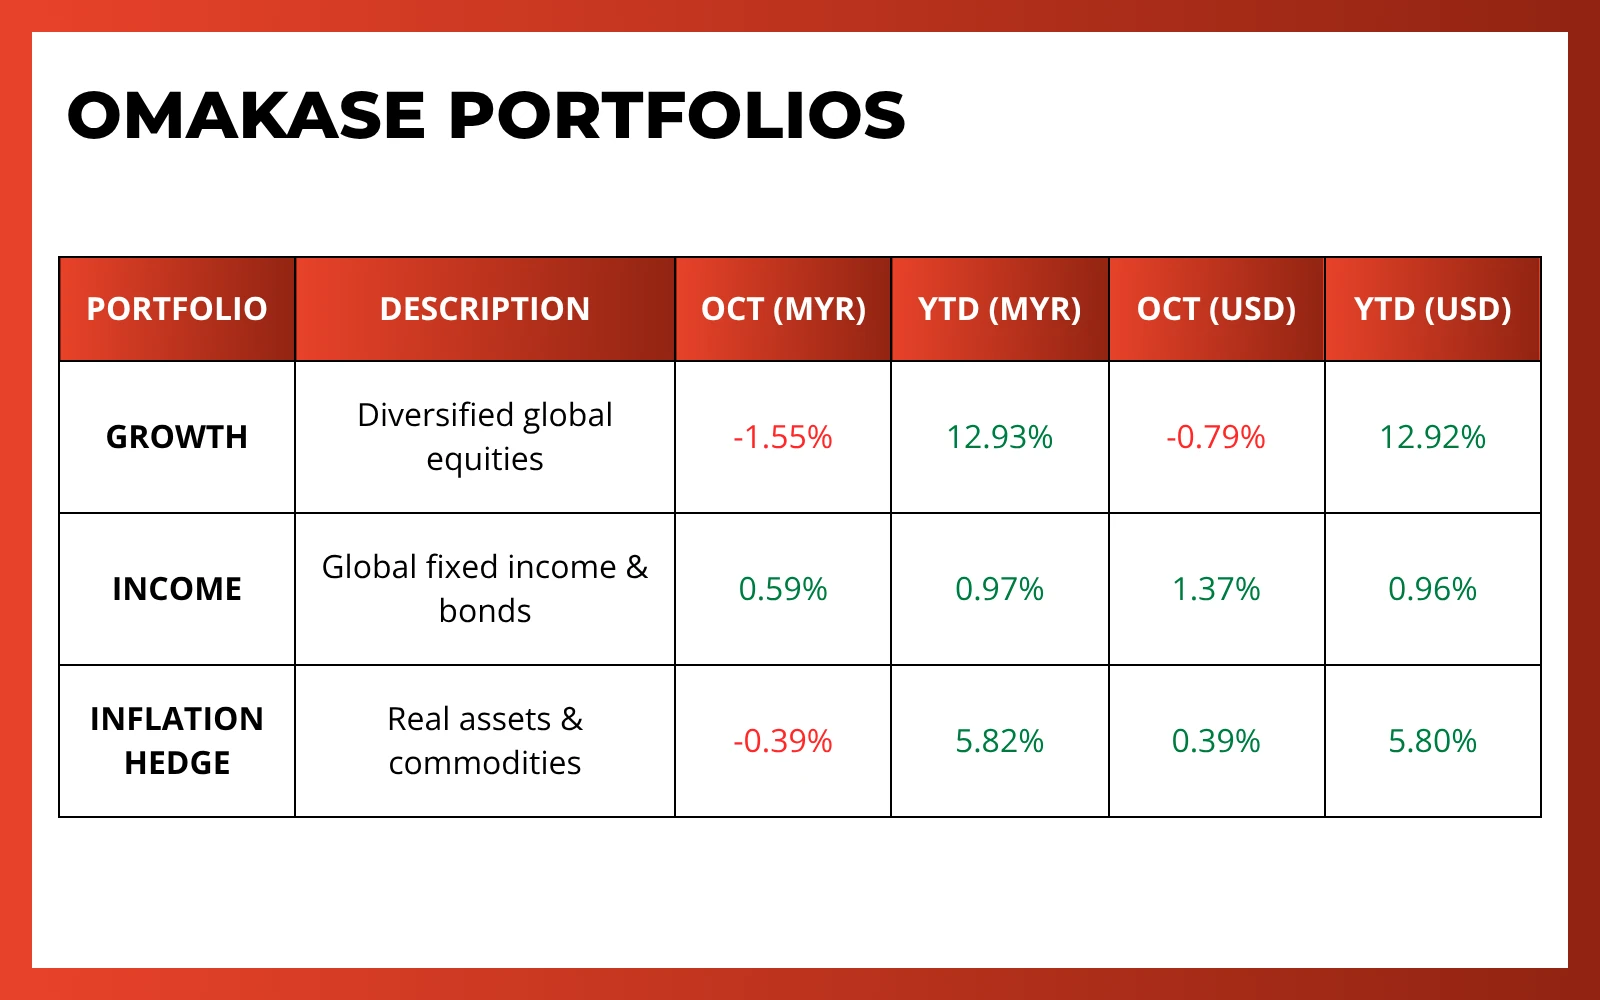
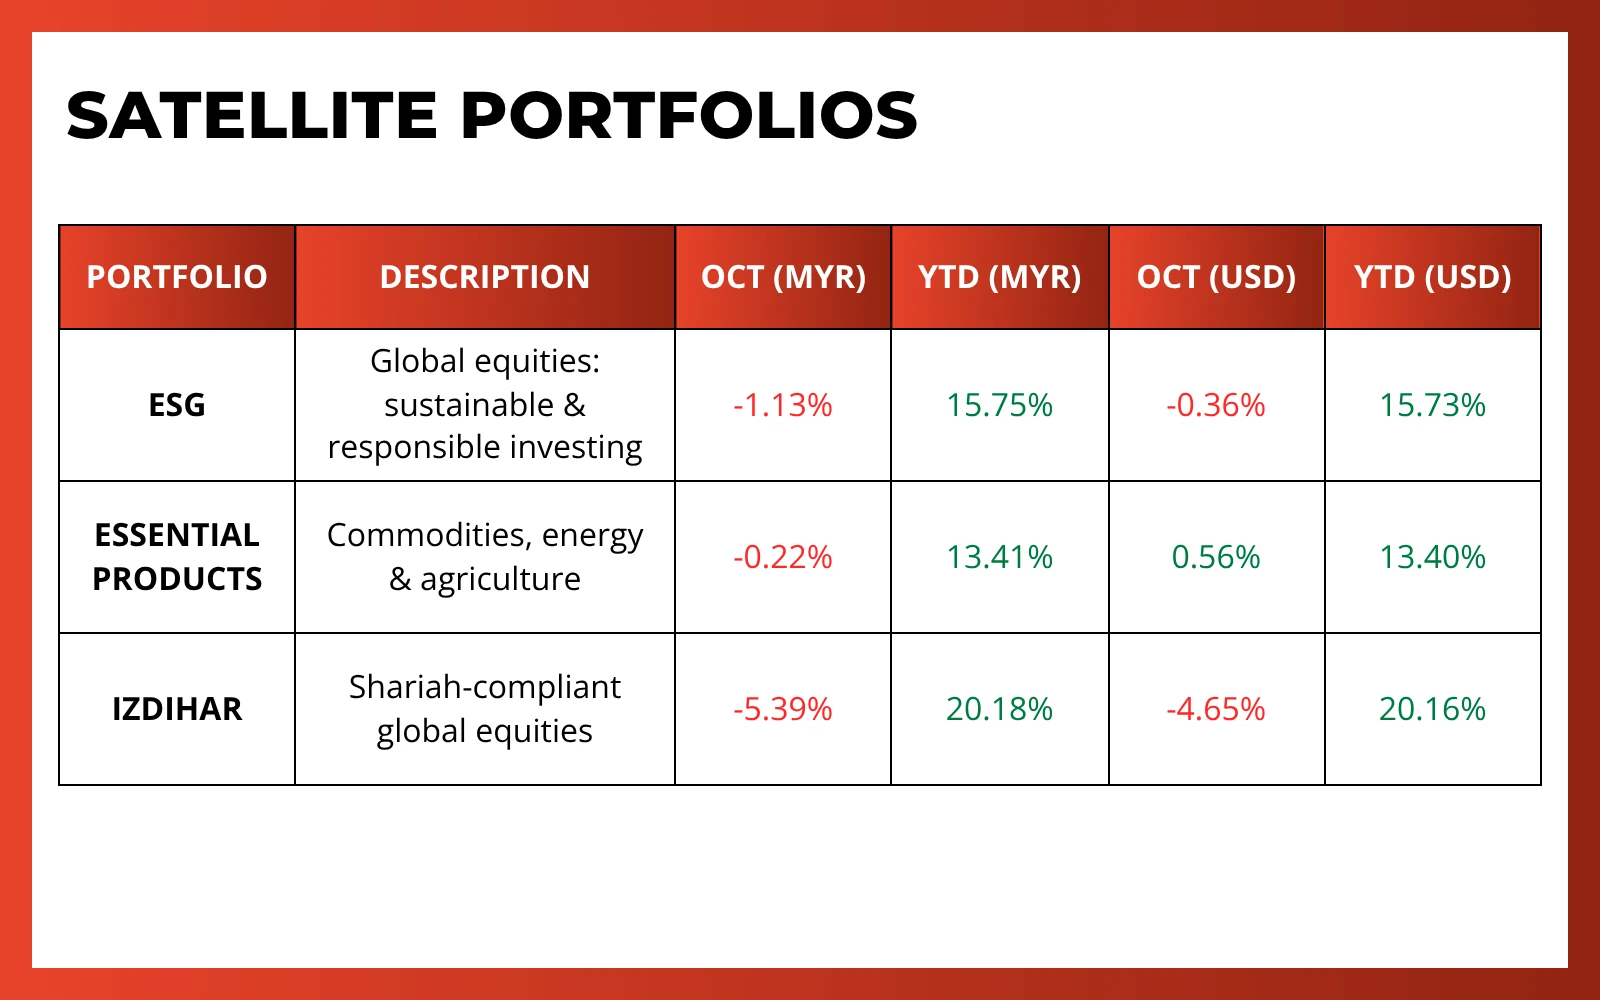
The following tables summarise October 2026 performance for the three Omakase functional portfolios and three satellite portfolios reviewed in this report.
1. Omakase Portfolios
Omakase combines Growth, Income & Inflation Hedge in proportions personalised to your risk profile. Your return reflects the allocation to these three functional portfolios, with actual account performance also affected by rebalancing and the timing of cash flows.
*Source: GAX MD Sdn Bhd, data for the month of October 2026
Past performance is not an indication of future performance.
2. Satellite Portfolios
Global ESG, Essential Products and Izdihar are standalone portfolios, each with its own investment theme. They can be held independently or alongside an Omakase allocation.
*Source: GAX MD Sdn Bhd, data for the month of October 2026
Past performance is not an indication of future performance.
3. MYTHEO Portfolio YTD Returns in MYR
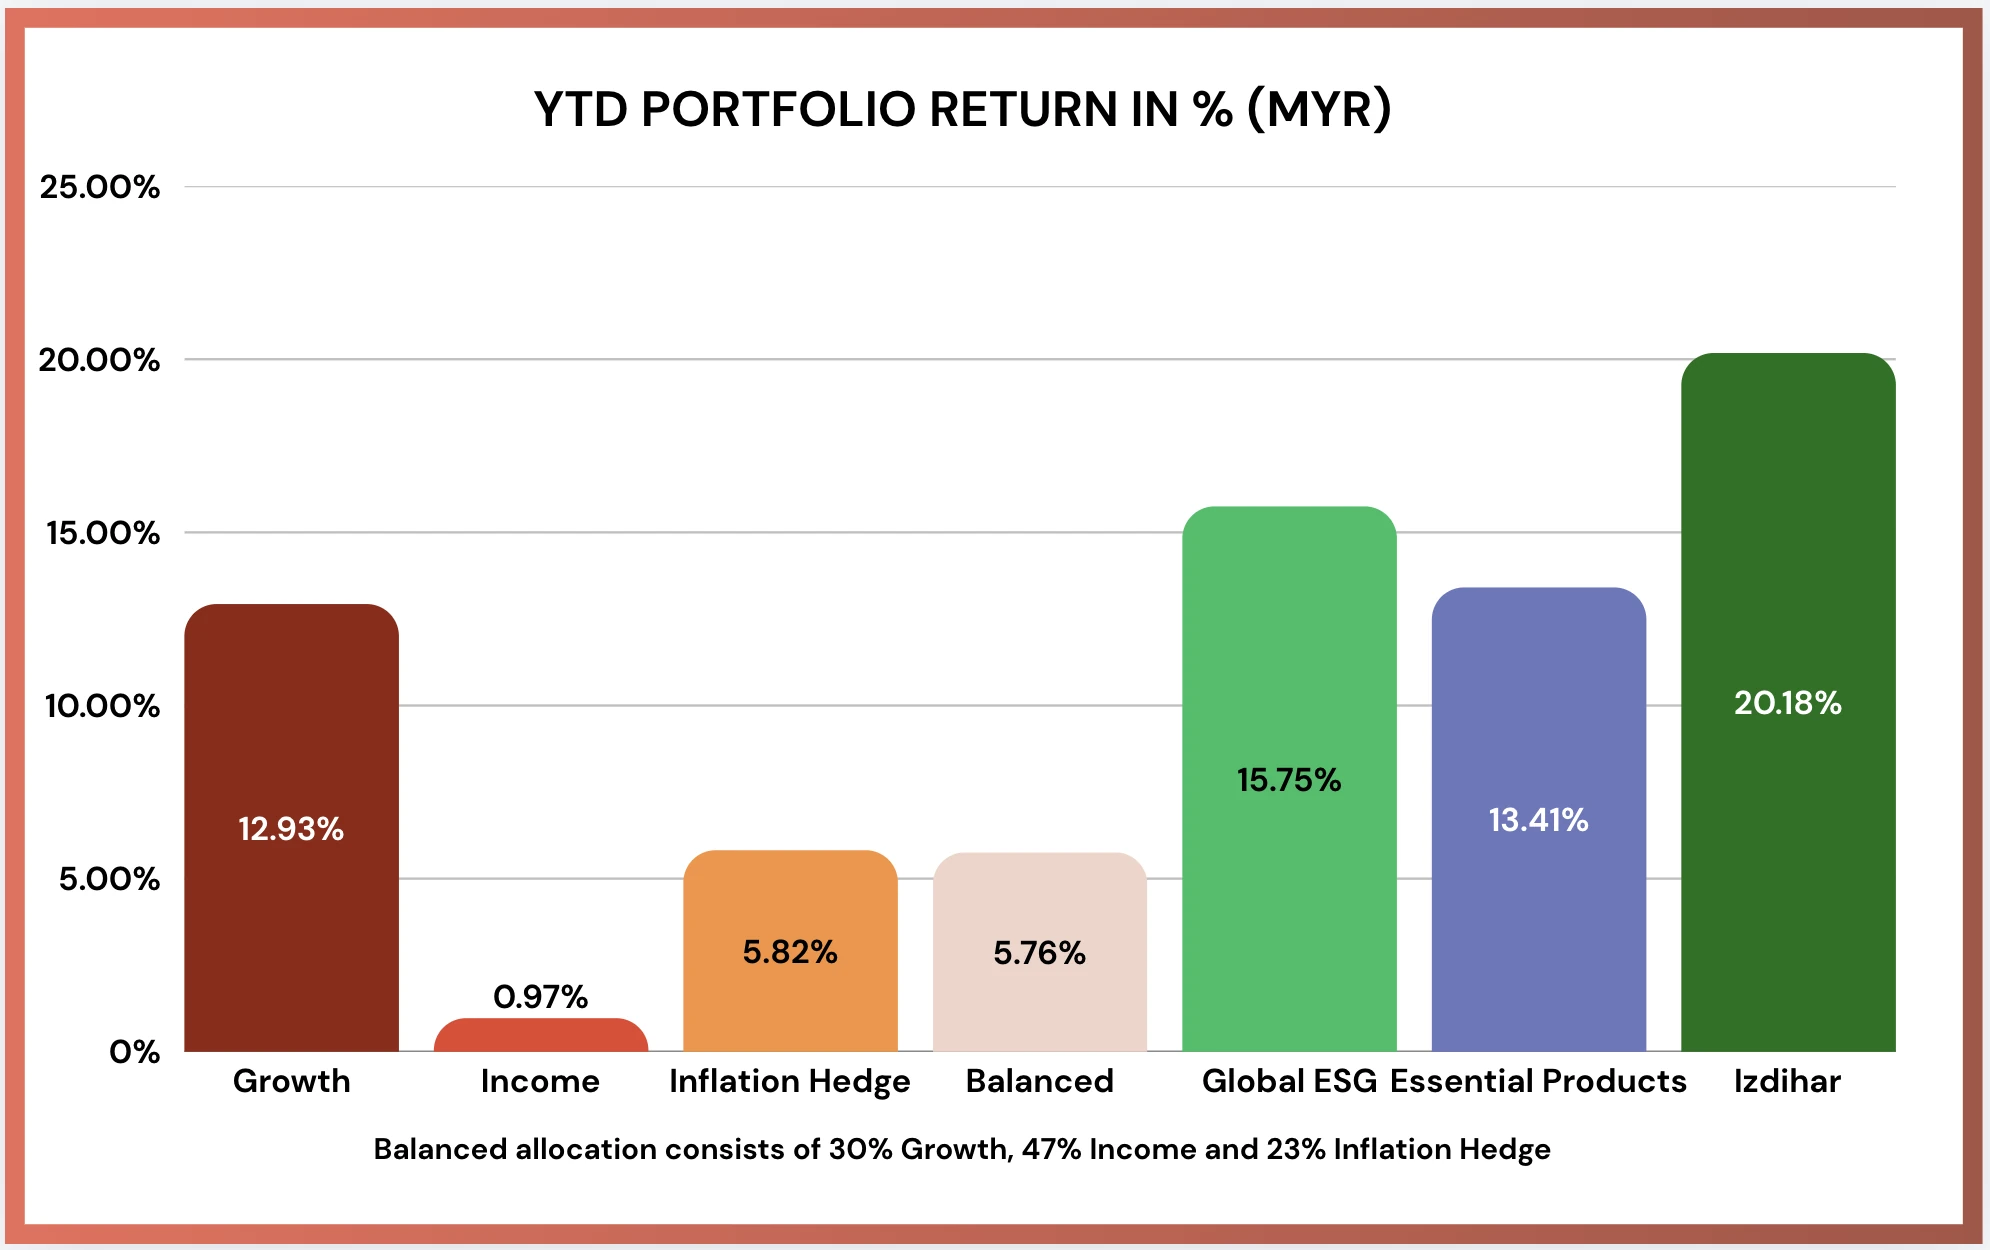
*YTD = Year to Date
*Source: GAX MD Sdn Bhd, data for the month of October 2026
Past performance is not an indication of future performance.
HOW TO CALCULATE YOUR OMAKASE RETURNS
A quick estimate applies your allocation weights to each portfolio’s YTD return. For a Balanced allocation of 30% Growth, 47% Income and 23% Inflation Hedge: [(30% x 12.93%) + (47% x 0.97%) + (23% x 5.82%)] ≈ 5.67%.
The Balanced figure in our chart, 5.76% YTD in MYR as of 30 October 2026, is slightly higher because it assumes the allocation is rebalanced back to 30/47/23 every month. Each month’s weighted return is compounded onto the previous month. For October, [(30% x -1.55%) + (47% x 0.59%) + (23% x -0.39%)] = -0.28%, which takes the Balanced YTD from 6.05% at the end of September to 5.76%.*
Your actual return varies based on your personal allocation, rebalancing and the timing of your deposits.
*Calculated using unrounded monthly returns.
Performance Commentary
October was characterised by sharp divergence rather than a broad decline across all asset classes. Growth and AI-related equities faced broad selling, while value shares, high-quality debt and selected real assets gained ground. Among the six MYTHEO portfolios, Income generated the highest monthly return, whereas Izdihar took the sharpest hit. Essential Products and Inflation Hedge posted gains in USD terms, though both turned negative once translated into MYR.
A broader market reassessment around artificial intelligence drove the rotation in equities. Market participants questioned whether the massive capital outlays for data centres and power infrastructure would produce matching revenue timelines, with funding costs and intensifying competition adding to the concern.
In monetary policy, the Federal Reserve kept the federal funds target range steady at 3.75% to 4.00% at its 28 October meeting. The accompanying statement recognised resilient economic growth alongside lingering inflation, emphasising that policymakers require more data before adjusting their policy stance.
Escalating tensions in the Middle East lifted crude oil prices, providing support to fossil energy assets while precious metals softened.
1. Sharp Value-Growth Divergence as Technology Weakness Weighed on Izdihar
This momentum shift across equities was clearly visible in Growth, ESG and Izdihar, which posted October MYR returns of -1.55%, -1.13% and -5.39% respectively. Growth and ESG held up substantially better than Izdihar because both maintained meaningful allocations to value stocks.
All five ETFs in the Izdihar portfolio retreated during the month. Global technology exposure via SPTE plunged 9.06%, while non-US global equities (SPWO) lost 7.55%. US Shariah equity holdings also weakened, with HLAL shedding 4.40% and SPUS dipping 1.84%, while UMMA pulled back 3.74%. Even with this monthly pullback, Izdihar preserved the highest YTD return among all six portfolios at 20.18% in MYR and 20.16% in USD.
The Growth portfolio experienced similar pain in its tech-heavy exposure: emerging markets (VWO) dropped 6.41%, Pacific equities (VPL) fell 6.13% and Index Growth (VUG) fell 5.60%. Value holdings, however, stepped up to cushion the blow. Mid-cap value (VOE) surged 7.96%, large-cap value (VTV) rose 5.53% and small-cap value (VBR) gained 5.37%, offsetting the growth decline and keeping overall portfolio losses contained.
The ESG portfolio demonstrated the same pattern. ESG Mid-Cap Value (NUMV) rose 6.05% and Large-Cap Value (NULV) gained 3.46%, providing a counterweight as the other six portfolio holdings dropped. Emerging market ESG equities (ESGE) slumped 8.71% and Large-Cap Growth (NULG) fell 5.74%. Developed markets outside North America (ESGD) held steady with a mild 0.32% dip, making it the third-best performer in the portfolio.
2. Energy and Real Estate Gains Offset Precious-Metal Weakness
Inflation Hedge gained 0.39% in USD but flipped to a 0.39% loss in MYR. Crude oil exposure (DBO) surged 14.02% as energy markets responded to heightened Middle East friction. Concurrently, falling Treasury yields provided breathing room for rate-sensitive real assets, propelling global infrastructure (IGF) up 6.89% and US real estate (IYR) up 4.86%.
Precious metals remained a major weak spot for the Inflation Hedge portfolio. Investors priced in expectations that a mid-term election win by the Democratic Party could pave the way for de-escalating conflict with Iran, triggering an 18.18% slide in silver (SLV) and a 6.63% decline in gold (IAU). Clean energy (ICLN) also dropped 9.94% as negative sentiment around AI capex spilled over into renewable energy suppliers expected to power future data facilities. Agriculture (DBA) fell 4.44% and base metals (DBB) shed 1.86%. These declines capped the gains captured in oil, infrastructure and property, while currency translation converted the modest USD gain into a 0.39% loss in MYR terms.
3. Essential Products Benefited from Energy and Water Holdings
In parallel with Inflation Hedge, Essential Products rose 0.56% in USD as strong performance in conventional energy and water utilities outpaced losses in battery and clean energy holdings. A negative MYR return of -0.22% demonstrates how slight USD gains can flip under currency translation.
US energy equities (XLE) led the portfolio with a 13.85% rally. Water infrastructure funds delivered solid results as well, with FIW advancing 8.15% and CGW climbing 2.76%. Agricultural equities were mixed: MOO rose 0.63%, while VEGI eased 0.42%.
Renewable and transition energy themes experienced negative spillover effects from the broader AI tech pullback. Lithium and battery technology (LIT) dropped 12.58%, clean energy (ICLN) shed 9.94% and wind energy equities (FAN) declined 3.92%.
4. Income Led as Longer-Duration Bonds Recovered
Income was the standout performer among the six portfolios in October, recording gains of 1.37% in USD and 0.59% in MYR. Nine of its eleven constituents advanced, led by longer-duration Treasuries and investment grade debt.
Treasuries maturing beyond 20 years (TLT) surged 5.64%, investment grade corporate bonds (LQD) gained 2.49% and intermediate Treasuries (IEI) climbed 2.00%. International sovereign debt also rallied, with BWX gaining 1.34% and IGOV rising 1.13%. These gains aligned with the broad pullback in benchmark yields, which dropped back below 5.0% to settle at 4.929% from 5.293% a month earlier.
The only two detractors in the Income portfolio were emerging market local currency debt (EMLC), which slid 0.49%, and senior loans (SRLN), which dipped 0.16%. EMLC suffered as several emerging market currencies weakened against the US dollar. SRLN edged down because floating rate coupons adjust in step with benchmark yields, reducing near-term income appeal as rates eased.
5. Conclusion
October offered a clear demonstration of market divergence in real time. Value stocks posted widespread gains above 5%, while growth stocks suffered comparable drops of over 5%. An investor positioned exclusively in growth equities would have lagged a value-focused strategy by more than ten percentage points in just a single month. This sharp divide underscores why anchoring capital to a single "favourable" theme carries real risk. One sudden rotation can unravel months of outperformance. To reduce this vulnerability, MYTHEO balances exposure across multiple asset themes, smoothing out the peaks and valleys for a less painful investment journey.
Fixed income told an equally telling story. After struggling under sticky inflation and climbing rates, Treasuries reversed course, with benchmark yields dropping from 5.293% in September to 4.929% in October. As noted previously, much of that earlier jump in yields was tied to tension near the Strait of Hormuz rather than lasting economic change. For investors who felt they missed out by holding an income strategy instead of going aggressive on equity, October proved its worth: it provided crucial downside protection during volatile swings and ended as the only portfolio with a positive return in MYR. This shows why MYTHEO's Omakase blend of Growth, Income and Inflation Hedge works, with each piece playing a distinct role in keeping your total portfolio steady across changing market cycles.
When evaluating asset allocation, enduring principles should guide the way: your personal objectives, time horizon, liquidity requirements and risk tolerance. Expanding wealth over the long run relies less on timing rotations and more on steady contributions paired with disciplined, systematic rebalancing. MYTHEO automates this process, utilising algorithmic rebalancing to adapt your portfolio to shifting market conditions so you can stay invested with confidence.
*This material is subject to MYTHEO's Notice and Disclaimer. All performance figures are net of management fees. Past performance is not indicative of future results.
Appendix
ETF Performance Summary by Portfolio | October 2026
1. Growth Portfolio
RISK: HIGH | Diversified global equities
2. Income Portfolio
RISK: LOW | Global fixed income & bonds
3. Inflation Hedge Portfolio
RISK: MEDIUM | Real assets & commodities
4. ESG Portfolio
RISK: HIGH | Global equities — sustainable & responsible investing
5. Essential Products Portfolio
RISK: HIGH | Commodities, energy & agriculture
6. Izdihar Portfolio
RISK: HIGH | Shariah-compliant global equities
*Returns are in USD terms for the month of October 2026.
Top and Bottom performers ranked by 1-month return within each portfolio. Past performance is not indicative of future results.
Ready to explore how MYTHEO works for your goals? Learn more about MYTHEO portfolios.
Or download the MYTHEO app from the App Store or Google Play.
*This material is subject to MYTHEO's Notice and Disclaimer. All performance figures are net of management fees.
Past performance is not indicative of future results.
This material is subject to MYTHEO’s Notice and Disclaimer.